An Analysis of The Loss Functions in Keras

Welcome to my friendly, non-rigorous analysis of the computer vision tutorials in keras. Keras is popular high-level API machine learning framework in python that was created by Google. Since I'm now working for CometML that has an integration with keras, I thought it was time to check keras out.  This post is actually part of a three article series.  My friend Yujian Tang and I are going to tag-team exploring keras together.  Glad you're able to come on this journey with us.

This particular article is about the loss functions available in keras.  To quickly define a loss function (sometimes called an error function), it is a measure of the difference between the actual values and the estimated values in your model.  ML models use loss functions to help choose the model that is creating the best model fit for a given set of data (actual values are the most like the estimated values). The most well-known loss function would probably be the Mean Squared Error that we use in linear regression (MSE is used for many other applications, but linear regression is where most first see this function.  It is also common to see RSME, that's just the square root of the MSE). 

Here we're going to cover what loss functions were used to solve different problems in the keras computer vision tutorials.  There were 68 computer vision examples, and 63 used loss functions (not all of the tutorials were for models). I was interested to see what types of problems were solved and which particular algorithms were used with the different loss functions.  I decided that aggregating this data would give me a rough idea about what loss functions  were commonly being used to solve the different problems.  Although I'm well versed in certain machine learning algorithms for building models with structured data, I'm much newer to computer vision, so exploring the computer vision tutorials is interesting to me. 

Things that I'm hoping to understand when it comes to the different loss functions available in keras:

  • Are they all being used?

  • Which functions are the real work horses?

  • Is it similar to what I've been using for structured data?

Before we get started, if you’ve tried Coursera or other MOOCs to learn python and you’re still looking for the course that’ll take you much further, like working in VS Code, setting up your environment, and learning through realistic projects.. this is the course I used: Python Course.

Let's start with the available loss functions. In keras, your options are:

The Different Groups of Keras Loss Functions

The losses are grouped into Probabilistic, Regression and Hinge.  You're also able to define a custom loss function in keras and 9 of the 63 modeling examples in the tutorial had custom losses. We'll take a quick look at the custom losses as well.  The difference between the different types of losses:

Probabilistic Losses - Will be used on classification problems where the ouput is between 0 and 1.

Regression Losses - When our predictions are going to be continuous.

Hinge Losses - Another set of losses for classification problems, but commonly used in support vector machines.  Distance from the classification boundary is taken into account and you're penalized if the distance is not large enough.

This exercise was also a fantastic way to see the different types of applications of computer vision. Many of the tutorials I hadn't thought about that particular application. Hopefully it's eye-opening for you as well and you don't even have to go through the exercise of looking at each tutorial!

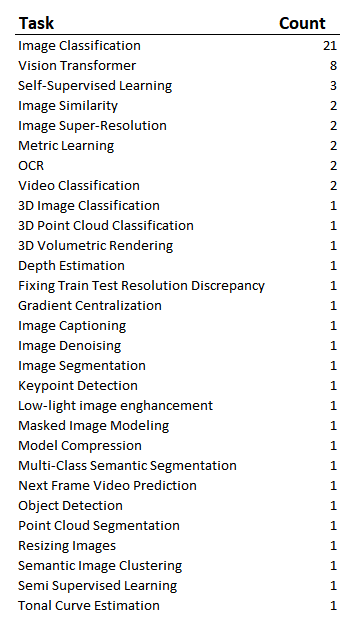
To have an understanding of the types of problems that were being solved in the tutorials, here's a rough list:

Image Classification Loss Functions

So of course, since Image classification was the most frequent type of problem in the tutorial, we're expecting to see many probabilistic losses.  But which ones were they? The most obvious question is then "which loss functions are being used in those image classification problems?"  

 We see that the sparse categorical crossentropy loss (also called softmax loss) was the most common. Both sparse categorical crossentropy and categorical cross entropy use the same loss function.  If your output variable is one-hot encoded you'd use categorical cross entropy, if your output variable is integers and they're class indices, you'd use the sparse function. Binary crossentropy is used when you only have one classifier . In the function below, "n" is the number of classes, and in the case of binary cross entropy, the number of classes will be 2 because in binary classification problems you only have 2 potential outputs (classes), the output can be 0 or 1.

Keras Custom Loss Functions

One takeaway that I also noticed is that there weren't any scenarios here where a custom defined loss was used for the image classification problems.  All the classification problems used one of those 3 loss functions. For the 14% of tutorials that used a custom defined function, what type of problem were they trying to solve? (These are two separate lists, you can't read left to right).

Regression Loss Functions

Now I was also interested to see which algorithms were used most frequently in the tutorial for regression problems.  There were only 6 regression problems, so the sample is quite small.

It was interesting that only two of the losses were used.  We did not see  mean absolute percentage error, mean squared logarithmic error, cosine similarity, huber, or log-cosh. It feels good to see losses that I'm most familiar with being used in these problems, this feels so much more approachable. The MSE is squared, so it will penalize large differences between the actual and estimated more than the MAE. So if "how much" your estimate is off by isn't a big concern, you might go with MAE, if the size of the error matters, go with MSE.

Implementing Keras Loss Functions

If you're just getting started in keras, building a model looks a little different. Defining the actual loss function itself is straight forward, but we can chat about the couple lines that precede defining the loss function in the tutorial (This code is taken straight from the tutorial). In keras, there are two ways to build models, either sequential or functional. Here we're building a sequential model. The sequential model API allows you to create a deep learning model where the sequential class is created, and then you add layers to it.  In the keras.sequentional() function there are the optional arguments "layers" and "name", but instead we're adding the layers piecewise. 

The first model.add line that we're adding is initializing the kernel.  "kernel_initializer" is defining the statistical distribution of the starting weights for your model.  In this example the weights are uniformly distributed. This is a single hidden layer model. The loss function is going to be passed during the compile stage. Here the optimizer being used is adam, if you want to read more about optimizers in keras, check out Yujian's article here.

from tensorflow import keras
from tensorflow.keras import layers

model = keras.Sequential()
model.add(layers.Dense(64, kernel_initializer='uniform', input_shape=(10,)))
model.add(layers.Activation('softmax'))

loss_fn = keras.losses.SparseCategoricalCrossentropy()
model.compile(loss=loss_fn, optimizer='adam')

Summary

I honestly feel better after taking a look at these computer vision tutorials. Although there was plenty of custom loss functions that I wasn't familiar with, the majority of the use cases were friendly loss functions that I was already familiar with. I also feel like I'll feel a little more confident being able to choose a loss function for computer vision problems in the future. Sometimes I can feel like things are going to be super fancy or complicated, like when "big data" was first becoming a popular buzzword, but then when I take a look myself it's less scary than I thought. If you felt like this was helpful, be sure to let me know.  I'm very easily findable on LinkedIn and might make more similar articles if people find this type of non-rigorous analysis interesting.

And of course, if you're building ML models and want to be able to very easily track, compare, make your runs reproducible, I highly suggest you check out the CometML library in python or R :)

Read More

Getting into Data Science FAQs

I often see similar questions in my inbox or asked in webinars.  I'd like to set the record straight with data.  However, I didn't need to start from scratch, there was an excellent article on KD Nuggets by Jeff Hale.  Here is the link to his article: "The Most in Demand Skills for Data Scientists".  He had already scoured multiple job search site and aggregated data on the demand for different skills for data scientist.  I recreated some of his analysis myself, so that I could come up with some points for this article, and to make sure his numbers matched mine before posting.  The charts I created below are based on data from searches on indeed.com only.  A search for "Data Scientist" was the denominator, and the numerator would be "Data Scientist" plus another term I was looking to see results for.  I'm not sure how many job descriptions listed on indeed.com might be duplicates, so this is not gospel, but still interesting.This article will cover a couple of "Frequently Asked Questions" using the methodology above (that was adopted from Jeff).

Questions I'm frequently asked:

  • Should I learn R or Python?

  • As a Computer Science major, can I get into data science?

  • How important is SQL?

Should I learn R or Python?This would most likely be the most frequently asked question (although I've never analyzed the questions that I'm asked).  In Jeff's article, you were able to see that Python has the edge in terms of coming up in job listings. I recreated the methodology for myself to look at this a little further.55% of the job listings actually list both tools, as in the company would like to see that you have experience with "Python and/or R".  That should make those who have a preference for one tool feel better.  If you're looking to pick up either R or Python and you're just getting your hands dirty, I'd suggest python.  For listings that only specify one tool, Python is almost 5x more likely to be listed as the tool of choice compared to R.I was happy to see this, as I've mentioned in a number of webinars and comments on social media that it "feels like" Python is slightly more popular.  It would have been a bummer if I had been giving misinformation this whole time. 

% of Data Science Positions Mentioning a Particular Skill on Indeed.com

Pulled this data by doing a search on indeed.com 11/2018

As a Computer Science major, can I get into data science?I'm always surprised when I see this question, because as someone who's been in the field for a long time, it just seems clear that this is a fantastic skill as your foundation for moving into data science.  Data science requires a number of different skills to be successful, and being able to program is definitely one of the core pillars.  Analytics and Statistics are coming in first, but Analytics and Statistics could easily be mentioned somewhere in the job description other than specifically where preferred degrees are mentioned.  If a job description says "computer science" they're most likely speaking to the degrees they would prefer from candidates.  More than 50% of job descriptions mention "computer science".  There you have it, a degree in computer science is something "in demand" for getting into data science.

% of Data Science Positions Mentioning a Particular Skill on Indeed.com

Pulled this data by doing a search on indeed.com 11/2018

How important is SQL?I'm frequently asked this question, and I was honestly surprised that SQL came in third behind Python and R in terms of skills.  However, 51% of jobs do mention SQL.  So it is certainly desired for the majority of positions, but I expected it to rank higher.  Is it possible this skill is becoming assumed as a prerequisite?  Or are companies figuring that SQL is easily learned and therefore not necessary to list on the job description? I wouldn't mind a job where all the datasets were aggregated for me before data cleaning and applying machine learning, I'm just not sure how many of those jobs exist.  If you're a data scientist, and you haven't had to understand relational databases at any point, let me know.  I'd love to hear about it.Conclusion:We saw that Python is preferred over R, but that either tool will allow you to apply to the majority of data science jobs in the US.  Computer science degrees are a great stepping stone to getting into data science, and the majority of listings will expect you to know SQL.I also want to point out that "communication" was very much in the top list of skills.  46% of job descriptions listed communication in the job description.  This means I'll continue to keep writing about how I use softer skills to be effective in my job.  I think we sometimes do not talk about communication enough in data science, it's really imperative to delivering models and analysis that are aligned with what the business is looking for.  If you'd like to see how Jeff used the data from the job search websites to discuss most in demand skills, here is the link one more time.  Link.

Read More
Career Career

Trying to Change Careers or Get Your Start in Data Science?

If you’re someone who is looking to make a move to data science, there are some ways that you can polish your approach to get noticed during your job search.

Assuming that you've built up the skills required for the job see if you're able to leverage some of these tips:

  • Optimize your resume (as best you can) for the job you WANT not the jobs you’ve HAD.

  • Try to gain experience at your current job (if you’re a career changer), or work on your own data science projects at home. (continuous learning is a big plus).

  • Develop a killer elevator pitch.

Optimizing your resume for the job you want:

Describe your projects in a way that shows you’re results-focused.

The points you’re going to want to demonstrate on your resume need to both:

  • Demonstrate that you understand general corporate culture, and showcase your collaborative, result achieving, problem solving and self-managing competencies.

  • Show that you have the technical chops as a data scientist.

The first bullet takes a lot of thought - it is really easy to list job duties, it’s another thing to reword them effectively to highlight your true strengths and demonstrate how what you've done has improved the business. Your bullet points should be full of action verbs and results, even if you need to stretch yourself mentally to identify these.

  • Did you automate a process that saved hours of time manually doing a task?  That time saved is business value.

  • Demonstrating that you've worked cross-functionally or presented results to the business are again, things that are desirable for the new job you want (data scientist).

It is helpful to read job descriptions and see what companies are looking for, you'll find consistent themes.  If you look closely, you'll see there are a lot of skills listed that aren't necessarily technical.  Make sure you shine when speaking to those softer skills.  But of course, these softer skills need to be demonstrated in a way that still demonstrates an action and result.  Do not just put a "soft skills" section on your resume and list a bunch of words with no context.

"Show you have the technical chops as a data scientist".  This is pretty straight-forward. Try to use the verbiage from the actual job description for the job you're applying to. You might want to sound fancy, but “empirical bayesian 3-stage hierarchical model” probably isn’t on the job description. Having this specifically listed on your resume isn’t going to help you pass ATS (the applicant tracking system), and the person in human resources who doesn’t have a data science background is not going to know whether that is relevant or not.  Again, looking at multiple job descriptions and trying to gauge what type of language to use on your resume is helpful.

Gain experience at your current job or work on a project:

If you currently have a job, do you have access to SQL? Does your company have a data warehouse or database? Can you file a ticket with the service desk to get SQL? Can you then play with data to make your own project?

You could even go a step further and bring data from the database into R or Python. Maybe you make a nice decision tree that answers a business questions then wonderfully and concisely place your results of your project on your resume.

Try to automate a task that’s repeatable that you do on a regular cadence. That’s next level resume content. You’re increasing efficiency in this scenario.

If you’ve done data science projects on your own to round out your resume, make sure those bullets are full of action verbs and results, action verbs and results. I almost want to say it a third time.

SQL Lite is open source, R is open source, Python is open source, there is tons of free data out there. The world can really be your oyster, but you’ll need to market these go-getter skills effectively.

Develop a killer elevator pitch:

A strong, well-targeted resume might open the door, but you need to keep that door open and keep the conversation going once the door has been opened. The resume does nothing more than open the door, that’s it.

Getting your resume into the right hands can sometimes be difficult. Leveraging LinkedIn effectively can help bridge that gap. How do we begin the conversation if you’re reaching out to someone on LinkedIn to ask about opportunities?

Important note: When cold reaching out to people on LinkedIn, this should be after you have visited the company website, found a job that you’re interested in and (pretty much) qualified for, and then you reach out to a relevant person with a well-targeted message.

It is impossible to be well-targeted if you are reaching out to someone who works at a company that doesn’t have any positions available. Because you didn’t read a job description. So you wouldn’t be able to infer the needs of the business. Data Science is a large field, with many specializations, a blanket approach will not work.

Back to the pitch. You’re results-focused, you’re innovative, and you view things from the business’ perspective.

  • I'd suggest starting with something conversational, this will help if the person you're messaging is already being inundated with requests.  A comment about a post they made recently makes your connection come across as more authentic.

  • Why you’re messaging: you’re interested in the open position, and you’re trying to get your resume to the correct person.

  • Then mention a number of things concisely that are specifically mentioned on the job description. Basically saying “hi, look at me, I’m a fit.”

  • Let them know that you’d really appreciate it if they’d simply forward you to the correct person (hopefully the person you’re messaging is the correct person, but there is also a chance it’s not the right person, so don’t assume).

  • Close strong. You’re here to add value for the company, not to talk about your needs; imply you’re aware that you’re here to talk about how you can fit the needs of the business.

Hi [name],

I enjoyed your recent post on [topic] and I look forward to reading more of your posts.

I noticed [company] is hiring for [position title], and I’m hoping I can get my resume in the right hands. I have an MS in Statistics, plus 7 years of real-world experience building models. I’m a wiz at SQL, modeling in R, and I have exposure to Python.

I’d appreciate the opportunity to speak with the appropriate person about the open position, and share how I’ve delivered insights and added value for companies through the use of statistical methods.

Thanks, Kristen

Now you may have a very different background from me. However, you can talk about the education that you do have (concisely), the exposure that you do have to building models, about your technical chops, and that you want to deliver value.

I hope that you’ll be able to use some of these suggestions. And I wish you a successful a rewarding career in data science. If you have additional suggestions for trying to make a change to data science, I’d love to hear your thoughts!  The next article I post will be covering how to write crisp content for your resume that makes an impact, that article is here.

Read More
Segmentation Segmentation

A Different Use of Time Series to Identify Seasonal Customers

I had previously written about creatively leveraging your data using segmentation to learn about a customer base. The article is here. In the article I mentioned utilizing any data that might be relevant. Trying to identify customers with seasonal usage patterns was one of the variables that I mentioned that sounded interesting. And since I'm getting ready to do another cluster analysis, I decided to tackle this question.

These are my favorite types of data science problems because they require you to think a little outside the box to design a solution.  Basically, I wanted to be able to tag each customer as whether or not they exhibited a seasonal pattern, this would be a first step.  Later I may further build this out to determine the beginning of each customer's "off-season."  This will allow us to nurture these customer relationships better, and provide a more personalized experience.

I'm a data scientist at Constant Contact, which provide email marketing solutions to small businesses.  Since it is a subscription product, customers have different usage patterns that I'm able to use for this analysis.

At first, my assumption was that a good portion of these customers might be living in an area that has four seasons.  You know, the ice cream shop in New England that shuts down for the winter.  After thinking about it some more, if I'm looking for seasonal usage patterns, this is also going to include people with seasonal business patterns that aren't necessarily driven by the weather.  People who have accounts in the education field taking summers off are going to be picked up as seasonal.  Businesses in retail who have pretty consistent usage all year, but pick up their engagement at Christmas are also exhibiting a seasonal pattern.  So the people who the model would determine were seasonal were not based solely on the weather, but could also be by the type of business.  (Or maybe there are people that are fortunate enough to take random long vacations for no reason in the middle of the year, I want to make sure I find those people too, if they exist).

To do this analysis, I aggregated the email sending patterns of each customer with at least 2 years by customer, by month.  Each customer is it's own time series. However, there were a couple complexities.  One detail in particular is worth noting, customers might take a month or two (or more) off from usage.  So first I had to write some code to fill in zeros for those months.  I couldn't be specifying that I was looking for a yearly pattern, but only giving 8 months worth of data per year in the model, I needed those zeros.  I found these missing zeros using Python, and then decided I wanted to use R for the time series/determining if a seasonal pattern was present portion.  I got to use the rpy2 package in Python for the first time. Check that off the list of new packages I've wanted to try.

I fit a TBATS model for each customer in R.  This is probably overkill, because TBATS was meant to deal with very complex (and potentially multiple) seasonal patterns.  However, it was really simple to ask the model if it had a yearly seasonal component.  Bonus, TBATS is more robust to stationarity than other methods. 

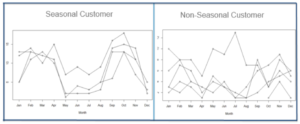
Here is a picture of a customer who the model determined to be seasonal, and on the right is a customer who is obviously not seasonal, and the model agrees.

seasonal vs non-seasonal graphAfter I had the output of my model, I went back and did a full analysis of what these customers looked like. They over-indexed in the Northeast, and were less likely to be in the West and South. Seasonal users were also more likely to self-report being in an industry like:

  • Retail
  • Sports and Recreation
  • Non Profits

Non seasonal users were also more likely to self-report being in an industry like:

  • Auto Services
  • Financial Advisor
  • Medical Services
  • Insurance

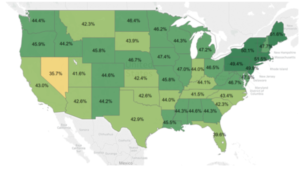
Customers with only 2-3 years tenure were less likely to be seasonal than more tenured customers.  This could potentially be due to a couple different factors.  Maybe there just wasn't enough data to detect them yet, maybe they have some period of getting acquainted with the tool (involving a different usage pattern) before they really hit their stride, or maybe they're just really not seasonal. There were more insights, but this is company data ;)Here is a map of seasonal customers over-indexing in the Northeast.  Stakeholders typically enjoy seeing a nice map.  Note:  The split was not 50/50 seasonal vs. non-seasonal.seasonal percentage mapAt the moment, we're thinking through what data we might be able to leverage in the upcoming segmentation (where this seasonal variable will be one candidate variable.  This might include information from the BigData environment or anything that lives in the relational database. We're also weighing difficulty to get a specific variable compared to the added value we might get from gathering that data.  I feel super fortunate to be able to work on projects that help us learn about our customers, so that when we message to them, we can be more relevant. Nothing is worse than receiving a communication from a company that totally misses the mark on what you're about. I find this type of work exciting, and it allows me to be creative, which is important to me. I hope you found this article enjoyable, and maybe there is a couple people out there that will actually find this applicable to their own work.  I wish you lots of fun projects that leave you feeling inspired :)Again, the code I used to do this project can be found in my article here.

A different use of time series to identify seasonal customers. Data science courses. Data Science resources. Data analysis, data collection , data management, data tracking, data scientist, data science, big data, data design, data analytics, behavior data collection, behavior data, data recovery, data analyst. For more on data science, visit www.datamovesme.com
Read More

What I Enjoyed Most at ODSC East 2018

Last week I had the opportunity to attend Open Data Science Conference (ODSC) in Boston.  It was awesome to see people just walking around who I had previously read about or I'm following them on twitter.  It was even nicer to meet some of these people, and I was amazed at how friendly everyone was.

Of course you can't attend everything at a conference like this, at one point there was 11 different sessions going on at once.  It was really difficult to determine which sessions to attend given the number of great options, but I tried to align the information I'd be consuming closely with what I'd be able to bring back to my day job and implement.

In this article I'll cover some learnings/ favorite moments from:

  • one of the trainings
  • a couple different workshops
  • the sweet conference swag
  • mention one of the keynotes

Trainings:My original plan was to take an R training in the morning on Tuesday and take a Python training that afternoon.  However, what really happened was I went to the R training in the morning, this training left me feeling super jazzed about R, and so I ended up going to another R training that afternoon (instead of the Python training I had originally planned on).  The morning R training I took was "Getting to grips with the tidyverse (R)" given by Dr. Colin Gillespie.  This was perfect, because I had been struggling with dplyr (an R package) the night previously, and this training went through parts of dplyr with great explanations along the way.  Colin also showed us how to create plots using the package "Plotly".  This was my first time creating an interactive graph in R. Easy to use, and super cool. He was also nice enough to take a look at the code I was currently working on, I definitely appreciated this.

The afternoon R training I attended was given by Jared Lander entitled "Intermediate RMarkdown in Shiny".  It was my first introduction to Shiny.  I had heard about it, but had never ventured to use it, now I don't know what I was waiting for. If you ever have the opportunity to hear Jared speak, I found him incredibly entertaining, and he explained the material clearly, making it super accessible.  I like to think Jared also enjoyed my overly animated crowd participation.  
Workshops:

On Thursday I attended "Uplift Modeling and Uplift Prescriptive Analytics: Introduction and Advanced Topics" by Victor Lo, PHD. This information really resonated with me.  Dr. Lo spoke about the common scenario in Data Science where you'll build a model to try and predict something like customer attrition.  You'd maybe take the bottom three deciles (the people with the highest probability of cancelling their subscription, and do an A/B test with some treatment to try and encourage those customers to stay.  

In the end, during analysis, you'd find that you did not have a statistically significant lift in test over control with the usual methods.  You end up in a situation where the marketers would be saying "hey, this model doesn't work" and the data scientist would be saying "what? It's a highly predictive model".  It's just that this is not the way that you should be going about trying to determine the uplift.  Dr. Lo spoke about 3 different methods and showed their results.  

These included:

  • Two Model Approach
  • Treatment Dummy Approach
  • Four Quadrant Method

Here is the link to his ODSC slides from 2015 where he also covered these 3 models (with similar slides): here 

I've experienced this scenario before myself, where the marketing team will ask for a model and want to approach testing this way.  I'm super excited to use these methods to determine uplift in the near future.

Another workshop I attended was "R Packages as Collaboration Tools" by Stephanie Kirmer (slides).  Stephanie spoke about creating R packages as a way to automate repeated tasks.  She also showed us how incredibly easy it is to take your code and make it an R package for internal use.  Here is another case that is applicable currently at my work.  I don't have reports or anything that is due on a regular cadence, but we could certainly automate part of the test analysis process, and there are currently ongoing requests asked of Analytics in our organization that could be automated.  Test analysis is done in a different department, but if automated, this would save time on analysis, reduce potential for human error in test analysis, and free up bandwidth for more high value work.SWAG:

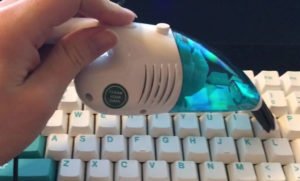
Although conference swag probably doesn't really need a place in this article, Figure Eight gave out a really cool little vacuum that said "CLEAN YOUR DATA".  I thought I'd share a picture with you.  Also, my daughter loved the DataRobot stickers and little wooden robots they gave out.  She fashioned the sticker around her wrist and wore it as a bracelet.  3 year olds love conference swag:

ODSC vacuum  ODSC stickers Keynote:The keynote was Thursday morning.  I LOVED the talk given by Cathy O'Neil, a link to her TED talk is here.  She spoke about the importance of ethics in data science, and how algorithms have to use historical data, therefore, they're going perpetuate our current social biases. I love a woman who is direct, cares about ethics, and has some hustle.  Go get em' girl. I made sure to get a chance to tell her how awesome her keynote was afterwards.  And of course I went home and bought her book "Weapons of Math Destruction".  I fully support awesome. Summary:I had an incredible time at the ODSC conference.  Everyone was so friendly, my questions were met with patience, and it was clear that many attendees and speakers had a true desire to help others learn. I could feel the sense of community.  I highly suggest that if you every get the opportunity to attend, go!  I am returning to work with a ton of new information that I can begin using immediately at my current job, it was a valuable experience.  I hope to see you there next year.

What I enjoyed most at Data Science Conference ODSC East 2018. Data analysis, data collection , data management, data tracking, data scientist, data science, big data, data design, data analytics, behavior data collection, behavior data, data recovery, data analyst. For more on data science, visit www.datamovesme.com
Read More
Career Career

The Successful Data Science Job Hunt

The point of this article is to show you what a successful Data Science job hunt looks like, from beginning to end. Strap-in, friends. I’m about to bring you from day 1 of being laid-off to the day that I accepted an offer. Seriously, it was an intense two months.I have an MS in Statistics and have been working in Advanced Analytics since 2010. If you’re new to the field, your experience may be different, but hopefully you’ll be able to leverage a good amount of this content.We’re going to cover how I leveraged LinkedIn, keeping track of all the applications, continuing to advance your skills while searching, what to do when you receive an offer, and how to negotiate.

Day 1 Being Laid-off

dyed my hair bright pink before job hunting

Vistaprint decided to decrease it’s employee headcount by $20 million dollars in employee salary, I was part of that cut. I was aware that the market was hot at the moment, so I was optimistic from day 1. I received severance, and this was an opportunity to give some real thought about what I would like my next move to be.I happened to get laid-off 4 days after I had just dyed my hair bright pink for the first time, that was a bummer.I actually went to one job interview with my pink hair, and they loved it. However, I did decide to bring my hair back to a natural color for the rest of my search.

Very First Thing I Did:

I am approached by recruiters pretty frequently on LinkedIn. I always reply.Although if you’re just getting into the field, you may not have past messages from recruiters in your LinkedIn mail, but I mention this so that you can start to do this throughout the rest of your career.Now that I was looking, my first action was to go through that list, message everyone and say:“Hi (recruiter person), I’m currently looking for a new opportunity. If there are any roles you’re looking to fill that would be a good fit, I’d be open to a chat.”

There were a number of people that replied back saying they had a role, but after speaking with them, it didn’t seem like the perfect fit for me at the moment.In addition to reaching out to the recruiters who had contacted me, I also did a google search (and a LinkedIn hunt) to find recruiters in the analytics space. I reached out to them as well to let them know I was looking. You never know who might know of something that isn’t on the job boards yet, but is coming on soon.

First Meeting With the Career Coach

As part of the layoff, Vistaprint set me up with a career coach. The information she taught me was incredibly valuable, I’ll be using her tips throughout my career. I met with Joan Blake from Transition Solutions. On our first meeting, I brought my resume and we talked about what I was looking for in my next role.Because my resume and LinkedIn had success in the past, she did not change much of the content on my resume, but we did bring my skills and experience up to the top, and put my education at the bottom.

They also formatted it to fit on one page. It’s starting to get longer, but I’m a believer in the one page resume.I also made sure to include a cover letter with my application. This gave me the opportunity to explicitly call out that my qualifications are a great match with their job description. It’s much more clear than having to read through my resume for buzzwords.I kept a spreadsheet with all of the companies I applied to. In this spreadsheet I’d put information like the company name, date that I completed the application, if I had heard back, the last update, if I had sent a thank you, the name of the hiring manager, etc.This helped me keep track of all the different things I had in flight, and if there was anything I could be doing on my side to keep the process moving.

Each Application:

For each job I applied to, I would then start a little hunt on LinkedIn. I’d look to see if anyone in my network currently worked for the company. If so, they’d probably like to know that I’m applying, because a lot of companies offer referral bonuses. I’d message the person and say something like:Hey Michelle,I’m applying for the Data Scientist position at ______________. Any chance you’d be willing to refer me?

If there is no one in my network that works for the company, I then try and find the hiring manager for the position. Odds are it was going to be a title like “Director (or VP) of Data Science and Analytics”, or some variation, you’re trying to find someone who is a decision maker.This requires LinkedIn Premium, because I’m about to send an InMail. My message to a hiring manager/decision maker would look something like:

Hi Sean,I’m interested in the remote Data Science position, and I’m hoping I can get my resume in the right hands. I have an MS in Statistics, plus 7 years of real-world experience building models. I’m a wiz at SQL, modeling in R, and I have some exposure to Python.I’d appreciate the opportunity to speak with the appropriate person about the open position, and share how I’ve delivered insights and added value for company’s through the use of statistical methods.Thanks, Kristen

Most people actually responded, Joan (the career coach) was surprised when I told her about my cold-calling LinkedIn success.

I Started Applying to Jobs, and Started Having “Phone Screens”

Phone screens are basically all the same. Some were a little more intense and longer than others, but they were all around a half hour, and they’re typically with someone in HR. Since it’s HR, you don’t want to go too deep in the technical stuff, you just want to be able to pass this stage, follow up with a note thanking them for their time, and try to firm up when you’ll be able to speak with the hiring manager :)Tell me about yourself:People just want to hear that you can speak to who you are and what you’re doing.

Mine was some variation of:

I am a Data Scientist with 7 years of experience using statistical methods and analysis to solve business problems across various industries. I’m skilled in SQL, model building in R, and I’m currently learning Python.

What are you looking to do?I’d make sure that what I’m looking to do ties directly to the job description. At the end of the day, it was some variation of:

“I’m looking to continuously learn new tools, technologies and techniques. I want to work on interesting problems that add business value”.

Then I’d talk about how interesting one of the projects on the job description sounded.What are you looking for in terms of salary?Avoid this question if you can, you’ll be asked, but try to steer in a different direction. You can always reply with “I’ve always been paid fairly in the past, I trust that I’ll be paid fairly working for [insert company name]. Do you have an idea of the salary range for the position”.They’ll know the range for the position, but they’ll probably tell you that they don’t. Most of the time I’d finally concede and give them my salary, this doesn’t mean that you won’t be able to negotiate when you receive an offer.

All The While, I’m Still Learning, And Can Speak to This in Interviews:

If I was going to tell everyone that I was very into learning technologies, I better be “walking the walk” so to speak. Although I am constantly learning, because it’s in my nature. Make sure that if you say you’re learning something new, you’re actually studying it.

The course I took was: Python for everybody

Disclaimer: This is an affiliate link, meaning that at no cost to you, I will earn a commission if you end up signing up for this course.

This course goes over your basic lists, arrays, tuples, defining a function.. but it also goes over how to access and parse web data. I had always wanted to know how to access Twitter data for future analysis, so this was super cool. The specialization (that’s the name they give for a series of courses on Coursera) also gives a brief overview in how to construct a database. This was a super bonus for me, because if I want to operationalize a model, I’m going to want to know how to write from Python to a database table. All-in-all, I found this course to be a great use of my time, and I finished it being able to speak to things intelligently, that I was not able to speak to prior to taking the course.

In Person Interviews:

I've written a whole article on in person interviews: here

At some point, you might receive a call saying they plan on putting an offer together for you, if you're still interested.Great! You’ve got an offer coming. At this point, you want to call all the other companies that you would consider an offer from and say “I’ve been informed that I am expecting an offer, is there anything you can do to accelerate your process?”I mentioned this to 2 companies. One of them did speed up their process and it resulted in an additional offer.  The other company said that they would not speed up their process, I thanked them for their time and said I'd hope to cross paths in the future.

Negotiating:

The phone rings, and you answer. This is it, you’re getting your first offer. It’s time to negotiate. Only a relatively small percentage of people ever negotiate their salary, the percentage is even smaller when we’re talking about women.Ladies! Negotiate! I’m here rooting for you, you got this.Joan from Transition Solutions had coached me on this. She said “Don’t try and solve the problem for them”.When they call, let them know how excited you are that they called, and that you’re interested in hearing their offer.

Once you’ve heard the salary, vacation time, and that they’re going to send over the benefits information, you can say something along the lines of:

"Thank you so much for the offer, I really appreciate it. You know, I was hoping that you could do more on the salary."

Then wait for a response, and again be positive. They’ll most likely say that they need to bring this information back to the hiring manager."

Great! I look forward to hearing back from you. I’ll take some time to look over the benefits package. Want to speak again on ____. I’m feeling confident that we can close this."

Then you’d be walking away from the conversation with a concrete time that you’ll speak to them next, and you let them know that you were happy to hear from them, all of this is positive!I successfully negotiated my offer, and started a week later. I couldn’t be happier with where I am now and the work I’m doing. It took a lot of applying and a lot of speaking with companies who weren’t “the one”, but it was worth it.To sum up my job search. I learned that a targeted cover letter and directly applying on a company website greatly increase the response rate on your applications.

I learned that you can effectively leverage LinkedIn to find the decision maker for a position and they’ll help keep the process moving if you’re a good fit. I also gained a ton of confidence in my ability to articulate my skills, and this came with practice. I wish you lots of success on your hunt, and I hope that there was a couple of tips in this article that you are able to use :)

The successful data science job hunt. Data analysis, data collection , data management, data tracking, data scientist, data science, big data, data design, data analytics, behavior data collection, behavior data, data recovery, data analyst. For more on data science, visit www.datamovesme.com.

Read More

What Getting a Job in Data Science Might Look Like

I’ve read a number of articles stating how hard it was to get into Analytics and Data Science. This hasn’t been my experience, so I wanted to share. We’ll look at interviewing, the tools I currently use, what parts of industry I wasn’t prepared for in school, and what my career trajectory has looked like. But not in that particular order.It probably makes sense to quickly recap my education before we dive in!

  • In 2004 — Completed a BS in Mathematics from UMASS Dartmouth

  • Had a 3.8 GPA in my major

  • Took FORTRAN while there (wasn’t good at it)

  • No internships

  • I LOVE math, and loved my time in school

Honestly, not much worth noting 2004–2007. I was “finding myself,” or something.In 2007 — Started MS in Statistics at WPI Part-Time while working for Caldwell Banker Real Estate Brokerage.

  • The “Housing bubble” burst (the kick-off for the Great Recession), and at the same time I was lucky to be offered a Teaching Assistantship at WPI.

  • Moved to Worcester and finished my MS Full-Time (Finished 2010)

  • Used SAS & R in classes

  • Still no internships (economy was bad, and I had yet to learn a ton about job searching, networking, and didn’t make use of the career center)

  • Thought I wanted to teach at a Community College, but two Professors asked if I’d be interested in interviewing at a local utility company (and the company happened to be 3 miles from my parents house).

I interviewed at that one company and took that job.At my first post-grad school industry job, NSTAR (now Eversource) I was a Forecast Analyst using Econometric Time-Series analysis to forecast gas and electric load (read — how much gas and electricity we need to service the customers).

Everyday I was building ARIMA models, using various statistical tests to test for structural breaks in the data, unit root tests for stationarity, and I wrote a proof to explain to the Department of Public Utilities why my choice of t-stats with a value > 1 (even though the p-value might be 0.2) were beneficial to have in the model for forecasting purposes.

I built cool Neural Nets to forecast hourly electric load. This methodology made sense because there is a non-linear relationship between electric load and the weather. The model results were fantastic, and were used to make decisions on how to meet capacity on days projected to need a high load.This is the first time that I learned that once you complete a project that people care about, you’ll most likely write a deck explaining the problem and outcomes.. and then you go “on tour”. Meaning, I created PowerPoint slides and presented my work to other teams. My first PowerPoint was not very good.

It has taken years of experience to get to a point where I now think that my decks are visually appealing, appropriately tailored for the audience I’m speaking to (have the right “level” of information), and engaging.

At NSTAR I also used a tiny bit of SAS. This was in the form of re-running code previously written by someone else. It sometimes also involved slightly modifying code that someone else had written, I definitely wouldn’t consider this job SAS intensive. More like “SAS button pushing”.

The models I was building everyday were built in “Point-and-Click” software.By far, NSTAR was my most “Statistic-y” job, but Time-Series is one small part in the world of Statistics. I wanted to expand my horizons, and learned that there was A TON of opportunity in Analytics…Quick Overview of The Rest Of My Positions: Analytics Consultant, Silverlink Communications

  • Delivered market research, segmentations, research posters, and communication campaigns designed to support managed care organizations (MCOs), pharmacy benefit managers (PBMs), and disease management (DM) clients.

Analytics Manager, Vistaprint

  • Vistaprint sells business cards and other marketing products online. Their main customer base is small businesses.

  • Managed a team of analysts to optimize the Vistaprint website.

  • Held a bunch of other roles and work on a ton of different projects across Analytics

Senior Data Scientist, Constant Contact

  • Contant Contact offers email marketing solutions. Also Ecommerce, also targets small businesses.

I’ve been at Constant Contact now for 2 months. My first goals are:

  • Checking the validity of a model that is already in place.

  • Improving upon how they currently do testing. And then automating!

  • Trying to identify seasonal customers in their customer base.

  • Learning lots of new things!

A Note on Titles: Titles are tricky. A title may sound snazzy and not pay as much, and sometimes a lower title could pay more than you expect!As leveraging data for business purposes is becoming increasingly popular, there is even more confusion around what roles and responsibilities and skills would typically fall under a certain title. Explore all of your options!You can check out average salaries for titles on a number of different sites.

The Tools I Use (Starting From Most Basic):Everywhere I have been has used Excel. The ability to do:

  • Pivot tables

  • V-lookups

  • Write a simple macro using the “record” button to automate some data manipulations

  • These types of things can make you look like a WIZARD to some other areas of the business. (Not saying it’s right, just saying that’s how it is)

  • And I’ve used these things THROUGHOUT my career.

As data is getting bigger, companies are starting to move towards Tableau. I’m still new to it myself, but it has saved me from watching an Excel document take forever to save. I consider the days of waiting on large Excel files to mostly be just a thing of my past.

  • Data quickly becomes too large for Excel, I’ve found that anything higher than like 400k rows (with multiple columns) becomes a real chore to try and manipulate.

  • Pretty visualizations, can be interactive, quick, point-and-click.

Data Science Tableau chart image

  • Tableau can also take data in directly from SQL (a .csv, and a bunch of other formats as well).

Data Science example of a simple query

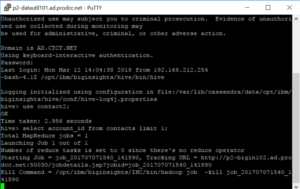
Data Science use the command line to access Hive

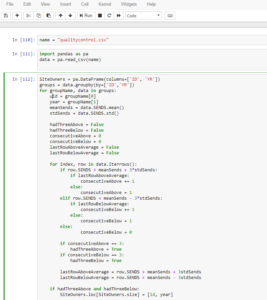
Data Science example of my Python code in JupyterLab

The real workhorse of a job in Data Science in SQL. It's becoming more common to pull directly to R or Python from SQL and do your data manipulation there, but this still requires connecting to the database.In school, most of the data was given to me in a nice form, all I had to bring to the table was analysis and modeling. In industry, you have millions of rows in 100’s or 1,000’s of different tables.

This data needs to be gathered from relevant tables using relevant criteria. Most of the time you’ll be manipulating the data in SQL to get it into that nice/useable form that you’re so familiar with. And this is time intensive, you’ll start to realize that a significant portion of your job is deciding what data you need, finding the data, transforming the data to be reasonable for modelling, before you ever write a line of code in R or Python.My last 3 jobs in industry have involved SQL, and I’ve only had 4 jobs.You can pull data directly from SQL into Excel or R or Python or Tableau, the list continues.

There are many different “flavors” of SQL. If you know one, you can learn any other one. In the past, I had been intimidated by job postings that would list APS or some other variant. There may be slight differences in syntax, but they’re really just asking you to know SQL. Don’t be intimidated!Below is an example of a simple query. I’m selecting some id’s, month, year, and the count of a variable “sends” based on criteria given in the “where” statement. The query also shows a couple table joins, denoted by “join”, and then I give the criteria that the join is on.Once you understand SQL, making the jump to BigData is not as daunting. Using Hive (also something that looked intimidating on a job description), is much like SQL (plus some nested data you might need to work with), you can query data from Hadoop.I use the command line to access Hive, but nice UIs are out there.

If you look closely, you’ll see my query here is just “select account_id from contacts limit 1;” all that says is “give me one account_id from the contacts table”, and it looks just like SQL.

When I was getting my Masters in Statistics, everyone was using R. Even some statisticians now are making the move to Python. Previously, all of my modeling has been in R, but I’m testing the Python waters myself!

I taught myself Python in Coursera, and I’m currently using it in my new job. That’s the beauty of the internet. Want to learn a new tool? Just go learn it, the information is at your fingertips.Below is an example of my Python code in JupyterLab. It brand-spanking new, and really my screenshot does not do it justice. You can read more about JupyterLab here: JupyterLab

A quick note. I put my Coursera classes I’ve taken under “accomplishments” in LinkedIn. It’s not a bad idea.

Things I Didn’t Know About Industry:

You might have some Opportunity for travel — Fun-ness of destination can vary

  • I’ve been to Vegas, Orlando, Barcelona, Windsor Ontario, NJ and MD for Work.

There is typically budget for personal development

  • A book you want to read that is relevant? You can probably expense it.

  • A course on Coursera that is relevant? You can probably expense it.

  • They’ll send you to conferences sometimes

    • Was at the Jupyter Pop-up March 21st and I’m attending the Open Data Science Conference in May.

      1. Don’t be shy about asking your boss if there is budget available.

        • To most it looks like you care about and are invested in your career!

Layoffs are a thing. I recently just learned about this first hand. And my experience was great.Vistaprint decided to downsize by $20m in employee salaries (182 people).

  • I got a pretty sweet severance package.

  • Tip! You can collect unemployment and severance at the same time!

This was the first opportunity I had in years to really think about the culture, direction, and really think about my next move.Vistaprint paid for a Career Coach that helped me with:

  • resume (they updated both my content and formatting).

  • Cover letter tips (description below)

  • Networking

  • Interviewing

  • Negotiating!

I literally took the requirements from the job and pasted them on the left. Then took my qualifications from my resume and posted them on the right. Took less than 15 minutes for each cover letter.

Interviewing

To read my more in-depth article about the in person interview in data science, click  here

To read my more in-depth article about the job hunt in data science from the first application to accepting a job offer, click 

here

The biggest takeaways I learned from the coach and my own experience interviewing for a Data Scientist position were…

Practice answering questions in the STAR format.

https://www.vawizard.org/wiz-pdf/STAR_Method_Interviews.pdf

In one phone screen (with Kronos), I was asked all of the questions I had prepared for:

  • Tell me about a time you explained a technical result to a non-technical audience?

  • Tell me about a time you improved a process?

  • Tell me a time about working with a difficult stakeholder, and how it was resolved?

TWO DAYS in a row, with different companies (one of them was Spotify), I was asked to answer FizzBuzz.

Prepare talking about one of your projects in a way that the person interviewing you (who may have little context) is able to understand. High Level, focus on outcomes. Seriously, before you start talking about the project, describe what the objective was, it’s really easy to dive into something and not realize the other person has no idea what you’re talking about.I could really keep talking forever about the topics listed above, but wanted to give a brief overview hitting a bunch of different pieces of my experience. Maybe I’ll need to elaborate more later.Thank you for reading my experience. I hope you have great success navigating your way into the field of Data Science. When you get there, I hope you find it fulfilling. I do.

What the successful data science job hunt might look like. Data analysis, data collection , data management, data tracking, data scientist, data science, big data, data design, data analytics, behavior data collection, behavior data, data recovery, data analyst. For more on data science, visit www.datamovesme.com.

Read More