A Different Use of Time Series to Identify Seasonal Customers
I had previously written about creatively leveraging your data using segmentation to learn about a customer base. The article is here. In the article I mentioned utilizing any data that might be relevant. Trying to identify customers with seasonal usage patterns was one of the variables that I mentioned that sounded interesting. And since I'm getting ready to do another cluster analysis, I decided to tackle this question.
These are my favorite types of data science problems because they require you to think a little outside the box to design a solution. Basically, I wanted to be able to tag each customer as whether or not they exhibited a seasonal pattern, this would be a first step. Later I may further build this out to determine the beginning of each customer's "off-season." This will allow us to nurture these customer relationships better, and provide a more personalized experience.
I'm a data scientist at Constant Contact, which provide email marketing solutions to small businesses. Since it is a subscription product, customers have different usage patterns that I'm able to use for this analysis.
At first, my assumption was that a good portion of these customers might be living in an area that has four seasons. You know, the ice cream shop in New England that shuts down for the winter. After thinking about it some more, if I'm looking for seasonal usage patterns, this is also going to include people with seasonal business patterns that aren't necessarily driven by the weather. People who have accounts in the education field taking summers off are going to be picked up as seasonal. Businesses in retail who have pretty consistent usage all year, but pick up their engagement at Christmas are also exhibiting a seasonal pattern. So the people who the model would determine were seasonal were not based solely on the weather, but could also be by the type of business. (Or maybe there are people that are fortunate enough to take random long vacations for no reason in the middle of the year, I want to make sure I find those people too, if they exist).
To do this analysis, I aggregated the email sending patterns of each customer with at least 2 years by customer, by month. Each customer is it's own time series. However, there were a couple complexities. One detail in particular is worth noting, customers might take a month or two (or more) off from usage. So first I had to write some code to fill in zeros for those months. I couldn't be specifying that I was looking for a yearly pattern, but only giving 8 months worth of data per year in the model, I needed those zeros. I found these missing zeros using Python, and then decided I wanted to use R for the time series/determining if a seasonal pattern was present portion. I got to use the rpy2 package in Python for the first time. Check that off the list of new packages I've wanted to try.
I fit a TBATS model for each customer in R. This is probably overkill, because TBATS was meant to deal with very complex (and potentially multiple) seasonal patterns. However, it was really simple to ask the model if it had a yearly seasonal component. Bonus, TBATS is more robust to stationarity than other methods.
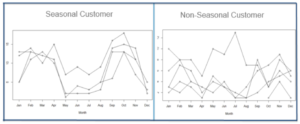
Here is a picture of a customer who the model determined to be seasonal, and on the right is a customer who is obviously not seasonal, and the model agrees.
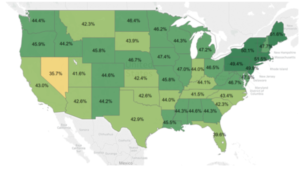
 After I had the output of my model, I went back and did a full analysis of what these customers looked like. They over-indexed in the Northeast, and were less likely to be in the West and South. Seasonal users were also more likely to self-report being in an industry like:
- Retail
- Sports and Recreation
- Non Profits
Non seasonal users were also more likely to self-report being in an industry like:
- Auto Services
- Financial Advisor
- Medical Services
- Insurance
Customers with only 2-3 years tenure were less likely to be seasonal than more tenured customers. This could potentially be due to a couple different factors. Maybe there just wasn't enough data to detect them yet, maybe they have some period of getting acquainted with the tool (involving a different usage pattern) before they really hit their stride, or maybe they're just really not seasonal. There were more insights, but this is company data ;)Here is a map of seasonal customers over-indexing in the Northeast. Stakeholders typically enjoy seeing a nice map. Note: The split was not 50/50 seasonal vs. non-seasonal. At the moment, we're thinking through what data we might be able to leverage in the upcoming segmentation (where this seasonal variable will be one candidate variable. This might include information from the BigData environment or anything that lives in the relational database. We're also weighing difficulty to get a specific variable compared to the added value we might get from gathering that data. I feel super fortunate to be able to work on projects that help us learn about our customers, so that when we message to them, we can be more relevant. Nothing is worse than receiving a communication from a company that totally misses the mark on what you're about. I find this type of work exciting, and it allows me to be creative, which is important to me. I hope you found this article enjoyable, and maybe there is a couple people out there that will actually find this applicable to their own work. I wish you lots of fun projects that leave you feeling inspired :)Again, the code I used to do this project can be found in my article here.

