What Getting a Job in Data Science Might Look Like
I’ve read a number of articles stating how hard it was to get into Analytics and Data Science. This hasn’t been my experience, so I wanted to share. We’ll look at interviewing, the tools I currently use, what parts of industry I wasn’t prepared for in school, and what my career trajectory has looked like. But not in that particular order.It probably makes sense to quickly recap my education before we dive in!
In 2004 — Completed a BS in Mathematics from UMASS Dartmouth
Had a 3.8 GPA in my major
Took FORTRAN while there (wasn’t good at it)
No internships
I LOVE math, and loved my time in school
Honestly, not much worth noting 2004–2007. I was “finding myself,” or something.In 2007 — Started MS in Statistics at WPI Part-Time while working for Caldwell Banker Real Estate Brokerage.
The “Housing bubble” burst (the kick-off for the Great Recession), and at the same time I was lucky to be offered a Teaching Assistantship at WPI.
Moved to Worcester and finished my MS Full-Time (Finished 2010)
Used SAS & R in classes
Still no internships (economy was bad, and I had yet to learn a ton about job searching, networking, and didn’t make use of the career center)
Thought I wanted to teach at a Community College, but two Professors asked if I’d be interested in interviewing at a local utility company (and the company happened to be 3 miles from my parents house).
I interviewed at that one company and took that job.At my first post-grad school industry job, NSTAR (now Eversource) I was a Forecast Analyst using Econometric Time-Series analysis to forecast gas and electric load (read — how much gas and electricity we need to service the customers).
Everyday I was building ARIMA models, using various statistical tests to test for structural breaks in the data, unit root tests for stationarity, and I wrote a proof to explain to the Department of Public Utilities why my choice of t-stats with a value > 1 (even though the p-value might be 0.2) were beneficial to have in the model for forecasting purposes.
I built cool Neural Nets to forecast hourly electric load. This methodology made sense because there is a non-linear relationship between electric load and the weather. The model results were fantastic, and were used to make decisions on how to meet capacity on days projected to need a high load.This is the first time that I learned that once you complete a project that people care about, you’ll most likely write a deck explaining the problem and outcomes.. and then you go “on tour”. Meaning, I created PowerPoint slides and presented my work to other teams. My first PowerPoint was not very good.
It has taken years of experience to get to a point where I now think that my decks are visually appealing, appropriately tailored for the audience I’m speaking to (have the right “level” of information), and engaging.
At NSTAR I also used a tiny bit of SAS. This was in the form of re-running code previously written by someone else. It sometimes also involved slightly modifying code that someone else had written, I definitely wouldn’t consider this job SAS intensive. More like “SAS button pushing”.
The models I was building everyday were built in “Point-and-Click” software.By far, NSTAR was my most “Statistic-y” job, but Time-Series is one small part in the world of Statistics. I wanted to expand my horizons, and learned that there was A TON of opportunity in Analytics…Quick Overview of The Rest Of My Positions: Analytics Consultant, Silverlink Communications
Delivered market research, segmentations, research posters, and communication campaigns designed to support managed care organizations (MCOs), pharmacy benefit managers (PBMs), and disease management (DM) clients.
Analytics Manager, Vistaprint
Vistaprint sells business cards and other marketing products online. Their main customer base is small businesses.
Managed a team of analysts to optimize the Vistaprint website.
Held a bunch of other roles and work on a ton of different projects across Analytics
Senior Data Scientist, Constant Contact
Contant Contact offers email marketing solutions. Also Ecommerce, also targets small businesses.
I’ve been at Constant Contact now for 2 months. My first goals are:
Checking the validity of a model that is already in place.
Improving upon how they currently do testing. And then automating!
Trying to identify seasonal customers in their customer base.
Learning lots of new things!
A Note on Titles: Titles are tricky. A title may sound snazzy and not pay as much, and sometimes a lower title could pay more than you expect!As leveraging data for business purposes is becoming increasingly popular, there is even more confusion around what roles and responsibilities and skills would typically fall under a certain title. Explore all of your options!You can check out average salaries for titles on a number of different sites.
The Tools I Use (Starting From Most Basic):Everywhere I have been has used Excel. The ability to do:
Pivot tables
V-lookups
Write a simple macro using the “record” button to automate some data manipulations
These types of things can make you look like a WIZARD to some other areas of the business. (Not saying it’s right, just saying that’s how it is)
And I’ve used these things THROUGHOUT my career.
As data is getting bigger, companies are starting to move towards Tableau. I’m still new to it myself, but it has saved me from watching an Excel document take forever to save. I consider the days of waiting on large Excel files to mostly be just a thing of my past.
Data quickly becomes too large for Excel, I’ve found that anything higher than like 400k rows (with multiple columns) becomes a real chore to try and manipulate.
Pretty visualizations, can be interactive, quick, point-and-click.
Data Science Tableau chart image
Tableau can also take data in directly from SQL (a .csv, and a bunch of other formats as well).
Data Science example of a simple query
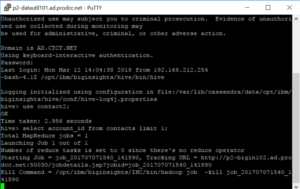
Data Science use the command line to access Hive
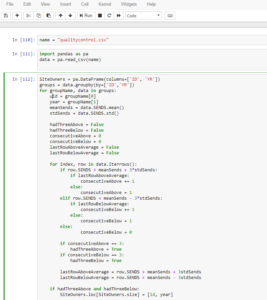
Data Science example of my Python code in JupyterLab
The real workhorse of a job in Data Science in SQL. It's becoming more common to pull directly to R or Python from SQL and do your data manipulation there, but this still requires connecting to the database.In school, most of the data was given to me in a nice form, all I had to bring to the table was analysis and modeling. In industry, you have millions of rows in 100’s or 1,000’s of different tables.
This data needs to be gathered from relevant tables using relevant criteria. Most of the time you’ll be manipulating the data in SQL to get it into that nice/useable form that you’re so familiar with. And this is time intensive, you’ll start to realize that a significant portion of your job is deciding what data you need, finding the data, transforming the data to be reasonable for modelling, before you ever write a line of code in R or Python.My last 3 jobs in industry have involved SQL, and I’ve only had 4 jobs.You can pull data directly from SQL into Excel or R or Python or Tableau, the list continues.
There are many different “flavors” of SQL. If you know one, you can learn any other one. In the past, I had been intimidated by job postings that would list APS or some other variant. There may be slight differences in syntax, but they’re really just asking you to know SQL. Don’t be intimidated!Below is an example of a simple query. I’m selecting some id’s, month, year, and the count of a variable “sends” based on criteria given in the “where” statement. The query also shows a couple table joins, denoted by “join”, and then I give the criteria that the join is on.Once you understand SQL, making the jump to BigData is not as daunting. Using Hive (also something that looked intimidating on a job description), is much like SQL (plus some nested data you might need to work with), you can query data from Hadoop.I use the command line to access Hive, but nice UIs are out there.
If you look closely, you’ll see my query here is just “select account_id from contacts limit 1;” all that says is “give me one account_id from the contacts table”, and it looks just like SQL.
When I was getting my Masters in Statistics, everyone was using R. Even some statisticians now are making the move to Python. Previously, all of my modeling has been in R, but I’m testing the Python waters myself!
I taught myself Python in Coursera, and I’m currently using it in my new job. That’s the beauty of the internet. Want to learn a new tool? Just go learn it, the information is at your fingertips.Below is an example of my Python code in JupyterLab. It brand-spanking new, and really my screenshot does not do it justice. You can read more about JupyterLab here: JupyterLab
A quick note. I put my Coursera classes I’ve taken under “accomplishments” in LinkedIn. It’s not a bad idea.
Things I Didn’t Know About Industry:
You might have some Opportunity for travel — Fun-ness of destination can vary
I’ve been to Vegas, Orlando, Barcelona, Windsor Ontario, NJ and MD for Work.
There is typically budget for personal development
A book you want to read that is relevant? You can probably expense it.
A course on Coursera that is relevant? You can probably expense it.
They’ll send you to conferences sometimes
Was at the Jupyter Pop-up March 21st and I’m attending the Open Data Science Conference in May.
Don’t be shy about asking your boss if there is budget available.
To most it looks like you care about and are invested in your career!
Layoffs are a thing. I recently just learned about this first hand. And my experience was great.Vistaprint decided to downsize by $20m in employee salaries (182 people).
I got a pretty sweet severance package.
Tip! You can collect unemployment and severance at the same time!
This was the first opportunity I had in years to really think about the culture, direction, and really think about my next move.Vistaprint paid for a Career Coach that helped me with:
resume (they updated both my content and formatting).
Cover letter tips (description below)
Networking
Interviewing
Negotiating!
I literally took the requirements from the job and pasted them on the left. Then took my qualifications from my resume and posted them on the right. Took less than 15 minutes for each cover letter.
Interviewing
To read my more in-depth article about the in person interview in data science, click here
To read my more in-depth article about the job hunt in data science from the first application to accepting a job offer, click
The biggest takeaways I learned from the coach and my own experience interviewing for a Data Scientist position were…
Practice answering questions in the STAR format.
https://www.vawizard.org/wiz-pdf/STAR_Method_Interviews.pdf
In one phone screen (with Kronos), I was asked all of the questions I had prepared for:
Tell me about a time you explained a technical result to a non-technical audience?
Tell me about a time you improved a process?
Tell me a time about working with a difficult stakeholder, and how it was resolved?
TWO DAYS in a row, with different companies (one of them was Spotify), I was asked to answer FizzBuzz.
Be ready for an entry level coding problem or SQL problem is the job description asks for one of those skills.
FizzBuzz: http://rprogramming.net/fizz-buzz-interview-test-in-r/
Prepare talking about one of your projects in a way that the person interviewing you (who may have little context) is able to understand. High Level, focus on outcomes. Seriously, before you start talking about the project, describe what the objective was, it’s really easy to dive into something and not realize the other person has no idea what you’re talking about.I could really keep talking forever about the topics listed above, but wanted to give a brief overview hitting a bunch of different pieces of my experience. Maybe I’ll need to elaborate more later.Thank you for reading my experience. I hope you have great success navigating your way into the field of Data Science. When you get there, I hope you find it fulfilling. I do.
What the successful data science job hunt might look like. Data analysis, data collection , data management, data tracking, data scientist, data science, big data, data design, data analytics, behavior data collection, behavior data, data recovery, data analyst. For more on data science, visit www.datamovesme.com.


