Workshops:
On Thursday I attended "Uplift Modeling and Uplift Prescriptive Analytics: Introduction and Advanced Topics" by Victor Lo, PHD. This information really resonated with me. Dr. Lo spoke about the common scenario in Data Science where you'll build a model to try and predict something like customer attrition. You'd maybe take the bottom three deciles (the people with the highest probability of cancelling their subscription, and do an A/B test with some treatment to try and encourage those customers to stay.
In the end, during analysis, you'd find that you did not have a statistically significant lift in test over control with the usual methods. You end up in a situation where the marketers would be saying "hey, this model doesn't work" and the data scientist would be saying "what? It's a highly predictive model". It's just that this is not the way that you should be going about trying to determine the uplift. Dr. Lo spoke about 3 different methods and showed their results.
These included:
- Two Model Approach
- Treatment Dummy Approach
- Four Quadrant Method
Here is the link to his ODSC slides from 2015 where he also covered these 3 models (with similar slides): here
I've experienced this scenario before myself, where the marketing team will ask for a model and want to approach testing this way. I'm super excited to use these methods to determine uplift in the near future.
Another workshop I attended was "R Packages as Collaboration Tools" by Stephanie Kirmer (slides). Stephanie spoke about creating R packages as a way to automate repeated tasks. She also showed us how incredibly easy it is to take your code and make it an R package for internal use. Here is another case that is applicable currently at my work. I don't have reports or anything that is due on a regular cadence, but we could certainly automate part of the test analysis process, and there are currently ongoing requests asked of Analytics in our organization that could be automated. Test analysis is done in a different department, but if automated, this would save time on analysis, reduce potential for human error in test analysis, and free up bandwidth for more high value work.SWAG:
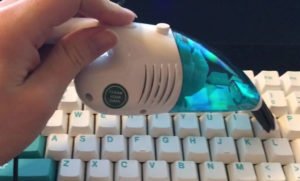
Although conference swag probably doesn't really need a place in this article, Figure Eight gave out a really cool little vacuum that said "CLEAN YOUR DATA". I thought I'd share a picture with you. Also, my daughter loved the DataRobot stickers and little wooden robots they gave out. She fashioned the sticker around her wrist and wore it as a bracelet. 3 year olds love conference swag:

 Keynote:The keynote was Thursday morning. I LOVED the talk given by Cathy O'Neil, a link to her TED talk is here. She spoke about the importance of ethics in data science, and how algorithms have to use historical data, therefore, they're going perpetuate our current social biases. I love a woman who is direct, cares about ethics, and has some hustle. Go get em' girl. I made sure to get a chance to tell her how awesome her keynote was afterwards. And of course I went home and bought her book "Weapons of Math Destruction". I fully support awesome. Summary:I had an incredible time at the ODSC conference. Everyone was so friendly, my questions were met with patience, and it was clear that many attendees and speakers had a true desire to help others learn. I could feel the sense of community. I highly suggest that if you every get the opportunity to attend, go! I am returning to work with a ton of new information that I can begin using immediately at my current job, it was a valuable experience. I hope to see you there next year.


