Business Science’s Time Series Course is Incredible
I’m a time series fan. Big fan. My first job out of grad school was for a utility company building econometric time series analysis and forecasting models. Lots of ARIMAs and neural nets. However, that was now over 10 years ago (don’t know how the hell that happened).
This post contains affiliate links that help to offset the cost of running the blog, plus the link gives you a special 15% discount. If you use the link, thank you!
I’m a time series fan. Big fan. My first job out of grad school was for a utility company building econometric time series analysis and forecasting models. Lots of ARIMAs and neural nets. However, that was now over 10 years ago (don’t know how the hell that happened).
In almost every position I've held in data, a question has come up that involved a time series (not a surprise that business cares about what has happened over time). Often, I was the only one who had any knowledge of time series on my team. I'm not sure why it isn't taught as a standard part of most university programs that are training data scientists, but it's just unfortunately not. I believe that understanding time series analysis is currently a great way to differentiate yourself, since many in the field are just not well versed in it.
I wanted to understand what was current in the world of applying time series analysis to business. It had been a real long time since I had given the subject some of the love and attention, and I thought taking this Business Science course would be the perfect way to do that.
My History With Business Science Courses:
I’ve previously written about Business Science’s first course, you can check it out here. I've also taken his first Shiny app course (there’s a more advanced one as well) and went from zero to Shiny app in 2 days using survey data I collected with Kate Strachnyi. It was a real win.
The app is still on my site here, just scroll down. For this little flexdashboard app I went from basically zero Shiny to having something that was useful in 2 days leveraging only the first 25% of the course. The course cannot actually be completed in 2 days. It's also worth noting that the course builds an app with much more functionality than mine. It’s a long course.
Back to the Time Series Review:
It’s broken into three different section:
Things I freakin’ love
The sexy
Everything else
Things I freakin’ love:
You’re learning about packages from the package creator. Who is going to understand a library better than the person who wrote it?. Matt built both modeltime and timetk that are used in this course. I find that super impressive. These packages are also a step up from what was currently out there from a "not needing a million packages to do what I want" perspective.
He uses his own (anonymized) data fromBusiness Science to demonstrate some of the models. I haven’t seen others do this, and I think it’s cool. It’s a real, practical dataset of his Google Analytics and Mailchimp email data with an explanation of the fields. If you don’t have analytics experience in e-commerce and are thinking about taking a role in e-commerce, definitely give some thought to this course.
I love how in-depth he gets with the subject. If you follow all that is covered in the course, you should be able to apply time series to your own data.
The Sexy:
Ok, so I’m sure some are interested in seeing just how “cutting edge” the course gets.
Once you're combining deep learning Gluon models and machine learning models using ensembling methods, you might be the coolest kid at work (but I’m not making any promises). Gluon is a package that was created by Amazon in Python. So you’ll leverage both Python and R for Gluon.
Some of the deep learning algorithms you’ll learn how to leverage are:
DeepAR
DeepVAR
N-Beats
Deep Factor Estimator
Module 18 of the course is where you'll get into deep learning. A couple years ago I might have said "deep learning, bah humbug, requires too much computing power and isn't necessary, simpler is better." As things change and progress (and computers get even more beefy) I'm definitely changing my tune. Especially as an ensemble N-Beats algorithm beat the ES-RNN's score in the M4 competition. M competitions are prestigious forecasting challenges, and they've historically been won by statistical algorithms. (I wouldn't have known this information without this course). The stuff being taught in this course is very current and the sexy new techniques that are winning the big competitions.
Here's a look at the syllabus for preparing the data and learning about the DeepAR model. You're doing log transformations, Fourier Series, and when you get to modeling the course even covers how to handle errors. I just love it. I know I'll be referring back to the course when a time series use case pops up in the future.
The course covers 17 different algorithms. I'm trying to think if I could name 17 algorithms off the top of my head… it’d take me a minute. ARIMA is obviously included, because It’s like the linear regression of time series. You’ll go through ARIMA, TBATS (a fave because you don’t need to worry about stationarity the way you do with ARIMA. I’ve used this one in industry as well).
Along with these other algos:
ARIMA Boost
Prophet Boost
Cubist
KNN
MARS
Seasonal decomposition models
Then you’ve got your ensemble algos being leveraged for time series:
GLMNET
Random Forest
Neural Net
Cubist
SVM
Strap in for 8 solid hours of modeling, hyperparameter tuning, visualizing output, cross-validation and stacking!
Everything else:
Matt (the owner of Business Science) speaks clearly and is easy to understand. Occasionally I'll put him on 1.25x speed.
His courses in general spend a good amount of time setting the stage for the course. Once you start coding, you’ll have a great understanding of where you’re going, goals, and context (and your file management will be top notch), but if you’re itching to put your fingers on the keyboard immediately, you’ll need to calm the ants in your pants. It is a thorough start.
You have to already feel comfy in R AND the tidyverse. Otherwise you’ll need to get up to speed first and Business Science has a group of courses to help you do that. You can see what's included here.
Before we finish off this article, one super unique part of the course I enjoyed was where Matt compared the top 4 time series Kaggle competitions and dissected what went into each of the winning models. I found the whole breakdown fascinating, and thought it added wonderful beginning context for the course.
In the 2014 Walmart Challenge, taking into account the “special event” of a shift in holiday sales was what landed 1st place. So you're actually seeing practical use cases for many of the topics taught in the course and this certainly helps with retention of the material.
Likewise, special events got me good in 2011. I was modeling and forecasting gas and the actual consumption of gas and number of customers was going through the roof! Eventually we realized it was that the price of oil had gotten so high that people were converting to gas, but that one tripped me up for a couple months. Thinking about current events is so important in time series analysis and we'll see it time and again. I've said it before, but Business Science courses are just so practical.
Summary:
If you do take this course, you’ll be prepared to implement time series analysis to time series that you encounter in the real world. I've always found time series analysis useful at different points in my career, even when the job description did not explicitly call for knowledge of time series.
As you saw from the prerequisites, you need to already know R for this course. Luckily, Business Science has created a bundle at a discounted price so that you can both learn R, a whole lot of machine learning, and then dive into time series. Plus you’ll get an additional 15% off the already discounted price with this link. If you're already comfortable in R and you're just looking to take the time series course, you can get 15% off of the single course here.
Edit: People have asked for a coupon to buy all 5 courses at once. That's something I'm able to do! Learn R, machine learning, beginner and advanced Shiny app development and time series here.
Hands-on SQL Practice For A Data Science Interview
I bet you're searching the internet for a fantastic reference to help you get ready for your SQL interview. You've landed in the right place.
Let's jump right in and get started. I have a SQL browser available for you to use here: Show me the data
The data is fictitious, but extensive and useful for writing queries.
You can use this browser to answer all of the questions below. When you're done, if you weren't able to answer a couple of the questions, you can give me your email address in the email form near the bottom of this article and I'll send you the query solutions.
This article is designed to help you with "white boarding" SQL questions. We're not going to cover any theory here. Just a bunch of questions and how to answer them leveraging SQL.
I wish you a ton of luck on your interview, I hope it results in an offer! If you're looking to further your SQL skills for data science, I have also created the ultimate course in SQL for data science. We cover tons of material that you won't see here, because feature engineering, handling NULLs, working with datetimes, etc., is not typically part of the interview. But if you want to really hit the ground running at your new job, I'd highly suggest this course. It's free and you can find it here
SQL Questions using just the select statement:
Write a query to determine the number of rows in the customer table. Answer: 351,962
What was the maximum commission paid in the customer table? The median? Answer: Max -$10,295, Average -$66.30
Write a query to that returns the customer_id, business_type and Country from the customer table.
SQL Questions using a where statement:
How many customers do we have "has_instagram" information for in the customer table? i.e. - How many rows are not NULL? Answer: 128,449
How many customers have a "First_conversion_date" greater than 1/1/2016 in the customer table? Answer: 54,397
SQL Question using a group by statement:
How many customers have "has_facebook" =1 in the customer table? Use a group by statement. Answer: 60,894
SQL Question using a group by and order statement:
Which state has the most customers? How many customers live in that state in the customer table? Answer: California, 43,736 customers
SQL Question using a having statement and subquery:
Using the billedservices table, how many customers had more than 1 billed service? Use a subquery to answer this question. Answer: 44
SQL Question requiring a join:
How many customers from OUTSIDE the United States have an entry in the billed services table? Answer: 89
In an interview, they'll typically place two or three pieces of paper up on the whiteboard. This will have your data. Obviously, this means that the data you'll be working with is much smaller.
Take home tests are typically much more difficult than what was covered here. During an in-person interview, they'll typically only have 30 minutes to an hour to assess your SQL knowledge. Most often, they just want to know that if you have SQL listed on your resume, that you can write some simple queries like up above.
I've never personally been asked to whiteboard the solution for creating a table, updating a column, etc., but obviously any SQL questions are fair game.
If you had no difficulty answering these questions, you're likely to do fine on your SQL interview.
Want to further your SQL skills for data science? Check out the Ultimate SQL for Data Science course.
Looking for the solutions to the questions above? I'll send them directly to your inbox :)
Free SQL for Data Science Course
I had previously created tons of SQL material, and then did nothing with it! It will certainly benefit those who are looking to learn SQL, so if that's you, jump right in! Here you'll be able to write your queries along with the videos. If you have dual monitors, that will make getting through this course much easier, but toggling back and forth on a single monitor can work too.
You'll write your queries here: SQL Browser.
This is what the browser looks like:

The videos below will take you from showing you around the browser and your very first select statement, all the way through cleaning data and feature engineering. Along with the videos, there are cheat sheets with all of the queries that we're writing throughout the course, so if you miss one or have difficulty following along, you can just copy and paste queries from the cheat sheet and assess how they're working. At the end, I have another article with SQL quiz questions you can use to lightly assess how well you retained the information.
The course:
Intro: Intro Video
Module 1: Module 1 Video
Slides: Module_1_slides
Module 2: Module 2 Video 1 and Module 2 Video 2 Cheat sheet: Module 2 Queries Slides: Module_2_slides
Module 3:Module 3 Video 1 and Module 3 Video 2 Cheat sheet: Module 3 Queries Slides: Module_3_slides
Module 4: Module 4 Video 1 and Module 4 Video 2 Cheat sheet: Module 4 Queries Slides: Module_4_slides
Module 5: Module 5 Video 1 and Module 5 Video 2 Cheat sheet: Module 5 Queries Slides: Module_5_slides
If you found this material useful please share this article or comment on the YouTube videos, I'd really appreciate it :)Test your skills here!
Choosing the Correct Statistic for Your Hypothesis Test
I fondly remember learning how to use countless statistics for evaluating hypothesis tests while getting my Master's degree. However, it was much more difficult to learn which method to call upon when faced with evaluating a real hypothesis test out in the world. I've previously written about scoping hypothesis tests with stakeholders, and test design and considerations for running hypothesis tests. To continue the saga, and complete the Hypothesis Testing trilogy (for now at least), I'd like to discuss a method for determining the best test statistic to use when evaluating a hypothesis test. I'll also take you through a code example where I compare the results of using 2 different statistics to evaluate data from a hypothetical ecommerce website.
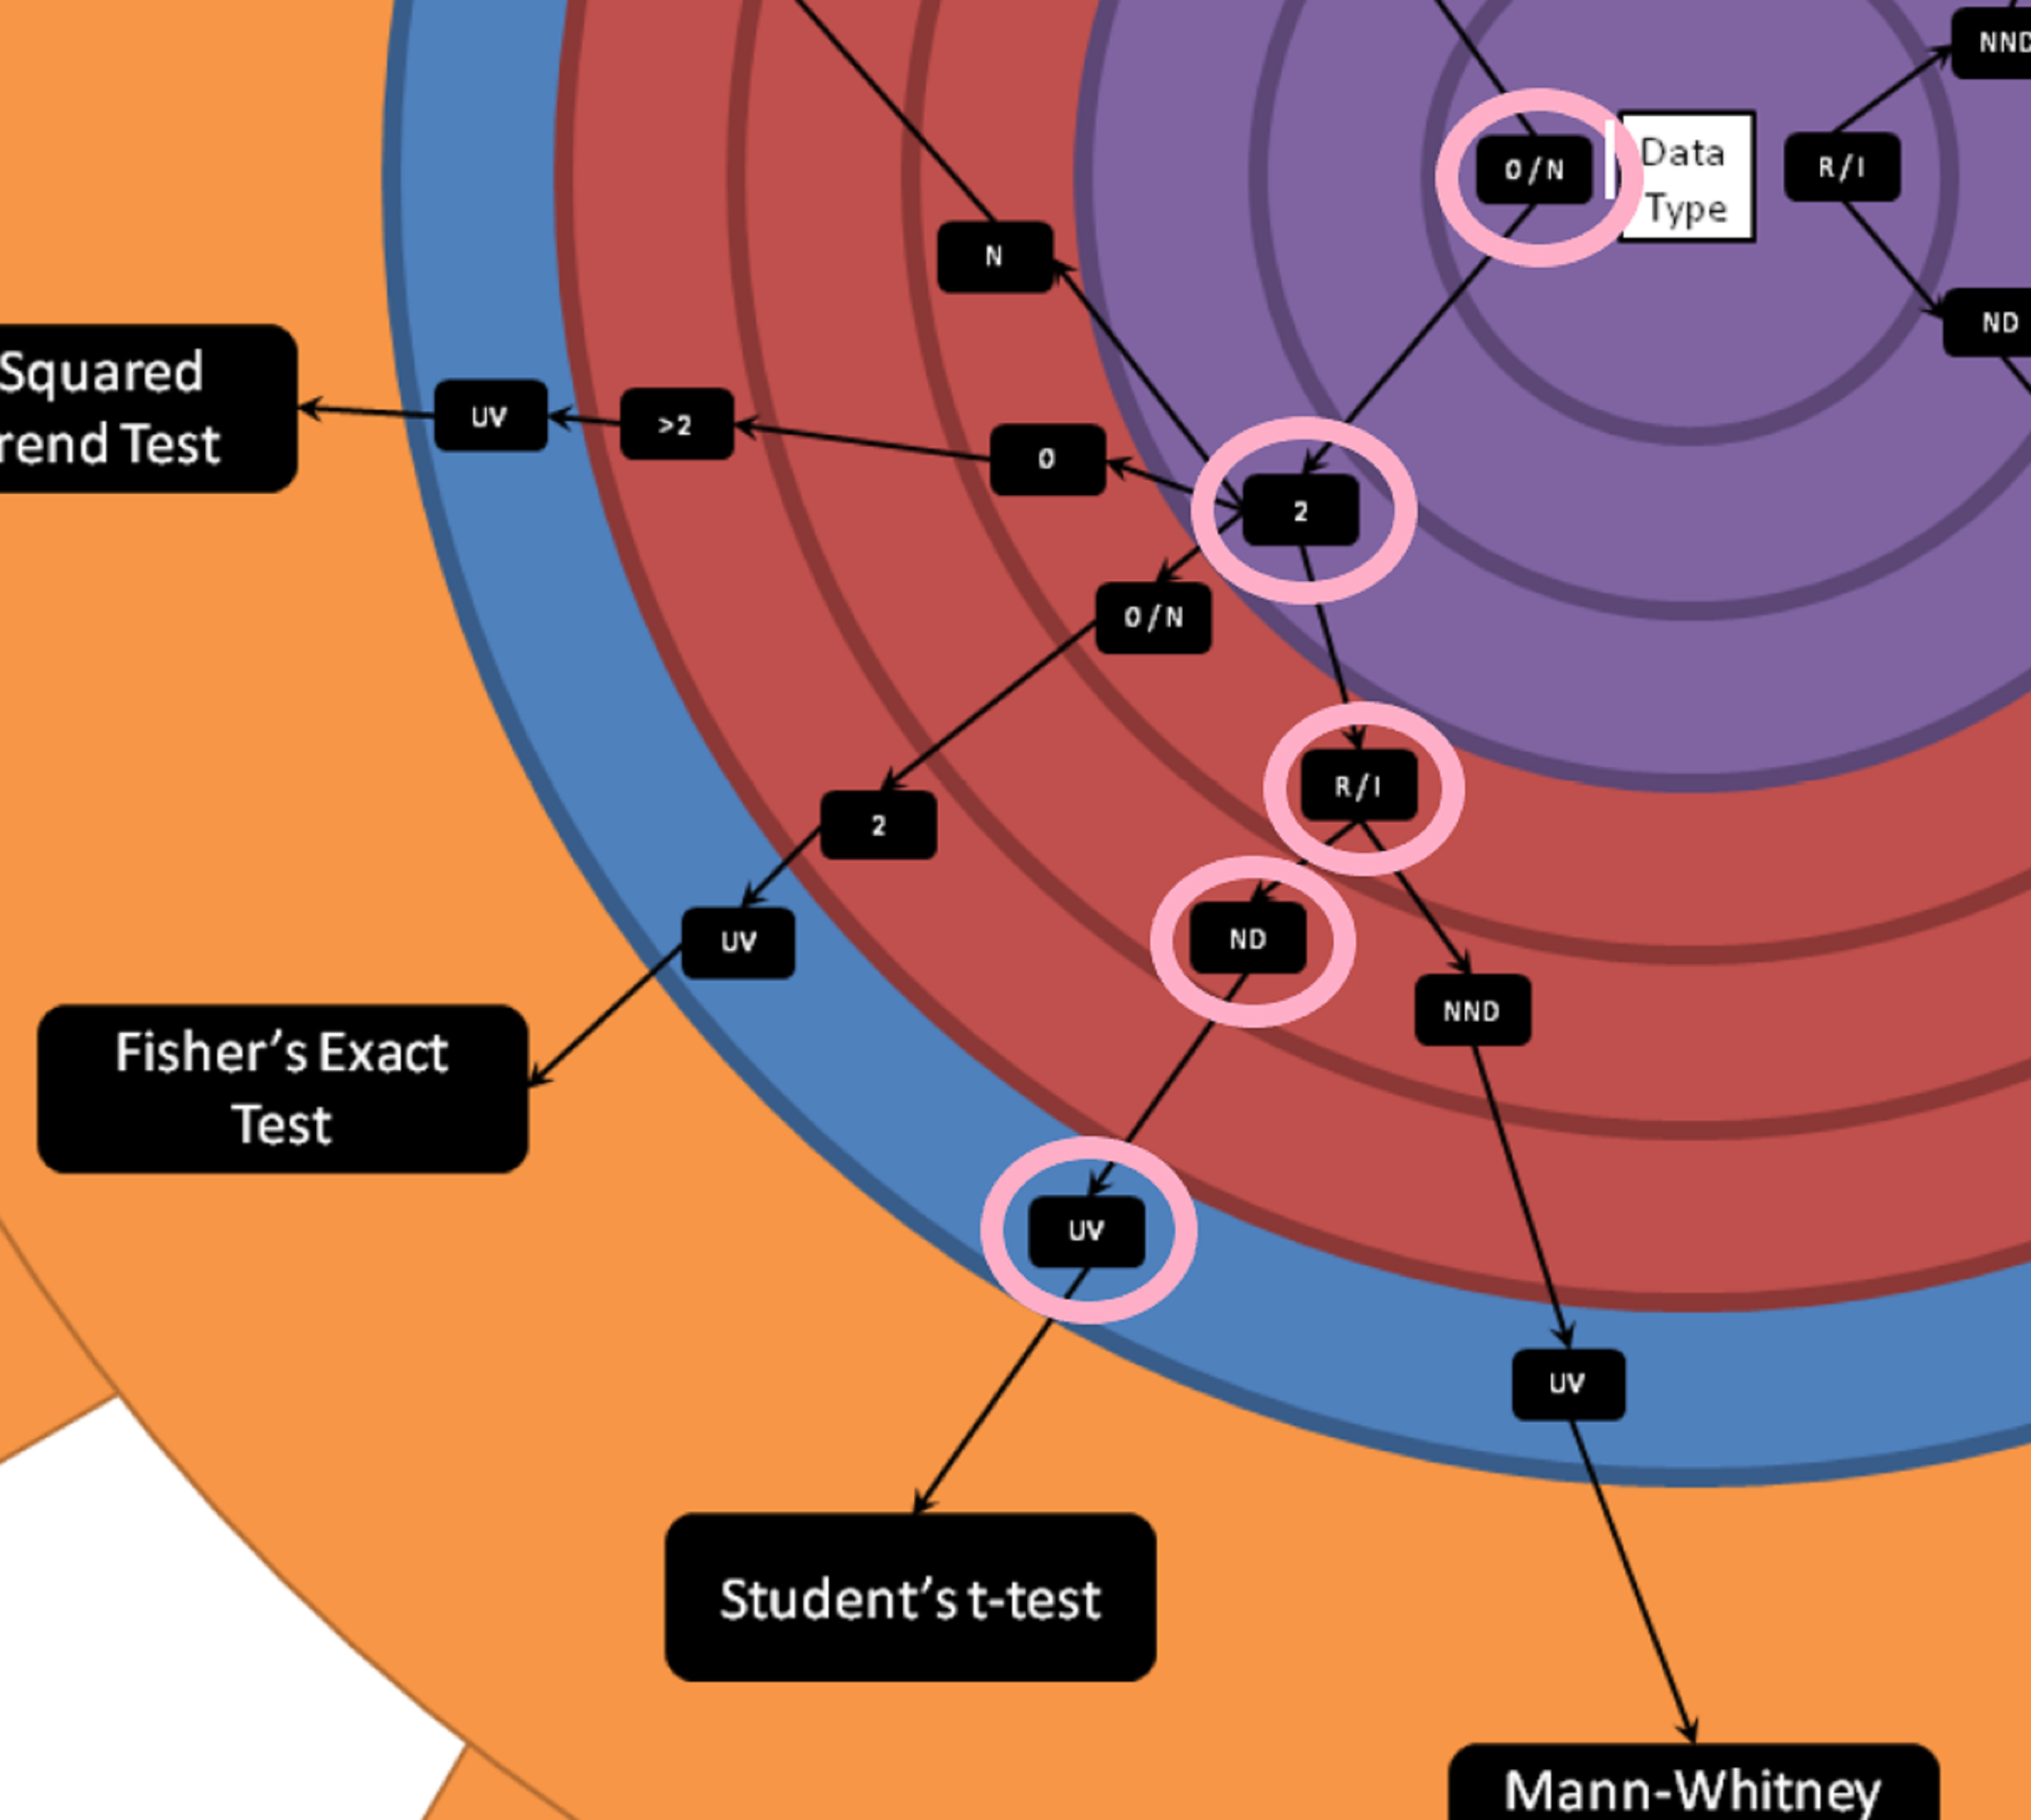
Lee Baker's Hypothesis Testing Wheel
Lee Baker from Chi2Innovations has developed a wonderful visual tool which, frankly, I wish I had when I was first learning about all the different types of test statistics. He calls it the "Hypothesis Testing Wheel", and it provides a repeatable set of questions whose answers will lead you to the best single choice for your situation. You can get a copy of this wheel in your inbox by giving your email at this link: I want a printout
Below is a picture of the wheel:

How to use the wheel
To determine which test statistic to use, you begin in the center of the large wheel and assess which data type you'll be testing.
Is the data in your test test:
Interval - Continuous, and the difference between two measures is meaningful.
Ratio - All the properties of an interval variable, variables like height or weight, but must also have a clear definition of 0.0 (and that definition has to be None).
Ordinal - Categorical, and ordered.
Nominal - Categorical, order doesn't matter
Mixed (multiple types of the above)
From the center you'll move outwards. And for continuous variables you'll need to determine next whether your variables are roughly normally distributed or not. In the example below we'll be looking at a hypothetical test of conversion on a website. Conversion rate is a proportion, but the individuals rows of data is categorical. Either a customer converts or does not convert. The mean of the proportion of customers who convert on a website is roughly normally distributed thanks to the Central Limit Theorem. In the case of categorical variables you're asked about the number of classes in your variable. You'll also need to determine whether your analysis is univariate or multivariate. In the hypothetical conversion example we're discussing, this is a univariate test.
Example using the wheel
In our example we have a hypothetical test on a website. Each visitor can either convert or not convert. This is ordinal data, as converting is set to 1, and converting is considered more valuable than not converting. We also know that we have 2 categories (converted or not converted). The outcome we're measure is the total proportion of converted customers, the data type for that would be ratio. We can assume rough normality due to the central limit theorem, and this is a univariate test. Therefore, we determine that we can use Student's t-test to evaluate our hypothetical test.
Example Analyzing in R
You're able to download the data and follow along here: hypothesis_test
This is a hypothetical website test. The dataset contains the following data:
test_assignment: Whether you were assigned to test or control
Conv: Where you're assigned to either the test or control group (test = 1, control = 0) and you either converted or did not convert (converted = 1)
Quantity: How much of the item you purchased (we're assuming only a single product is for sale, but you can buy multiple of that product)
Sales: The total price of the customers purchase
Cost_of_good: How much it costs to create the product
We'll call in the data and do some filtering to get the data ready for analysis. Then we'll perform a Student's t-test, the Chi-Sq test of Proportions, and compare the results.
Code
library(stats)  ##   For student's t-test
library(tidyverse)  ##   For data manipulation

# Set working directory, please update with your own file path:
# Remember backslashes need to be changed to forward slashes
setwd("[your path here]")

# reading in the data
web_test <- read.csv("hypothesis_test.csv")

# Looking at the structure of the data
str(web_test)

# Changing test_assignment to a factor variable.
# This is  a factor and not truly valued at 1 or 0
web_test$test_assignment <- as.factor(web_test$test_assignment)

# Remmoving those who saw both the test and control experience
# Or were duplicates in our data and saving as a new dataset.
web_test_no_dupes <- web_test %>%
  filter(!duplicated(customer_id))


# Creating a set with just test and just control so that the data is separated
test <- web_test_no_dupes %>%
  filter(test_assignment == 1)

control <- web_test_no_dupes %>%
  filter(test_assignment == 0)


###
# Student's t-test (assumes equal variance, otherwise it's Welch's t-test)
# here we pass the vectors of the 1's and 0's
test<- t.test(test$Conv, control$Conv, var.equal = TRUE)


###
# Chi-Squared Test of Equality of Proportions
# here I'm passing the total number of conversions in each group and the sample size in
# both test and control.

# creating a vector with numerator and denominator for the test
numerator <- c(sum(test$Conv), sum(control$Conv))
denominator <- c(length(test$Conv), length(control$Conv))

# Perforoming the Chi-Sq test below
# correct = FALSE is saying that I will not be using a continuity correction in this example
# setting it equal to TRUE would give us a slightly more conservative estimate.
chisq <- prop.test(numerator, denominator, correct = FALSE)
Output from the two tests


You'll notice that the confidence intervals are almost exactly the same. Both tests were statistically significant, but that was expected anyways because of the large difference between proportions. However, the most important thing when analyzing hypothesis tests is that you're consistent across your organization. You certainly do not want one person doing the analysis and returning a different result than if someone else had conducted the analysis.
If your R skills could use some work and you'd like to become truly proficient, I recommend the following R courses.
Summary:
I found Lee's cheat sheet quite handy (and I hadn't seen something like it previously). He also has a great blog where he focuses heavily on statistics. I find that when people are trying to learn stats, they're always looking for more resources to read up on the material. Lee's blog is a fantastic resource for free e-books, probability, stats, and data cleaning. A link to Lee's blog is here.
Thanks for reading! I'm happy to have added more content around hypothesis testing on my blog. If there is something you'd like me to dive into deeper, don't hesitate to leave a comment and ask. Happy hypothesis testing, see you soon :)
My Favorite R Programming Course
Note: This article includes affiliate links. Meaning at no cost to you (actually, you get a discount, score!) I will receive a small commission if you purchase the course.
I've been using R since 2004, long before the Tidyverse was introduced. I knew I'd benefit from fully getting up to speed on the newest packages and functionality, and I finally decided to take the plunge and fully update my skills. I wanted a course that was going to cover every nook and cranny in R. My personal experience learning R had been pasting together tutorials and reading documentation as I needed something. I wanted to be introduced to functions I may not need now, but may have a use case for in the future. I wanted everything.
I've known for a while that the Tidyverse was a massive improvement over using base R functionality for manipulating data. However, I also knew my old school skills got the job done. I have now seen the light. There is a better way. It wasn't super painful to make the move (especially since I'm familiar with programming) and the Business Science's "Business Analysis with R" course will take you from 0 to pretty dangerous in 4 weeks.
For the person with no R experience who doesn't want to bang their head on the wall for years trying to get to a "serious R user" level. I highly recommend this Business Science's "Business Analysis with R" course. Don't let the name fool you, the course spends 5 hours of using the parsnip package for machine learning techniques. And more importantly, how to communicate those results to stakeholders.
The course was thorough, clear, and concise.

Course Coverage
General:
The course takes you from the very beginning:
- Installing R
- Setting up your work environment
- full disclosure, I even learned new tips and tricks in that section
- and then straight into a relevant business analysis using transactional data
This course "holds your hand" on your journey to becoming self-sufficient in R. I couldn't possibly list everything in this article that is covered in the course, that would make no sense. However, the most life changing for me were:
- regex using stringr
- Working with strings is a different world in the Tidyverse compared to base R. I can't believe how much more difficult I had been making my life
- working with date times using lubridate
- The beginning of my career was solely in econometric time series analysis. I could have used this much earlier.
- formatting your visualizations
- This is another area where I have lost significant hours of my life that I'll never get back through the process of learning R. Matt can save you the pain I suffered.
All of the material that I would have wanted was here. All of it.
Modeling & Creating Deliverables:
Again, do not let the title of the course fool you. This course gets HEAVY into machine learning. Spending 5 HOURS in the parsnip library (it's the scikit learn of R).
The course goes through:
- K-means
- Regression & GLM
- tree methods
- XGBoost
- Support Vector Machines
And then teaches you how to create deliverables in R-markdown and interactive plots in Shiny. All in business context and always emphasizing how you'll "communicate it to the business". I can't stress enough how meticulous the layout of the course is and how much material is covered. This course is truly special.
How many tutorials or trainings have you had over the years where everything looked all "hunky dory" when you were in class? Then you try to adopt those skills and apply them to personal projects and there are huge gaping holes in what you needed to be successful. I have plenty of experience banging my head on the wall trying to get things to work with R.
Things You'll Love:
- Repetition of keyboard short-cuts so that I'll actually remember them.
- Immediately using transactional data to walk through an analysis. You're not only learning R, you're learning the applications and why the functions are relevant, immediately.
- Reference to the popular R cheatsheets and documentation. You'll leave here understanding how to read the documentation and R cheatsheets - and let's be honest, a good portion of being a strong programmer is effective googling skills. Learning to read the documentation is equivalent to teaching a man to fish.
- Matt has a nice voice. There, I said it. If you're going to listen to something for HOURS, I feel like this a relevant point to make.
For the beginner:
- Instruction starts right at the beginning and the instruction is clear.
- Code to follow along with the lecture is crazy well organized. Business Science obviously prides itself on structure.
- There is no need to take another R basics course, where you'd repeat learning a bunch of stuff that you've learned before. This one course covers everything you'll need. It. Is. Comprehensive.
- e-commerce/transactional data is an incredibly common use case. If you're not familiar with how transactional data works or you've never had to join multiple tables, this is fantastic exposure/a great use case for the aspiring data scientist.
- A slack channel with direct access to Matt (course creator) if you have any questions. I didn't personally use this feature, but as a newbie it's a tremendous value to have direct access to Matt.
I'm honestly jealous that I wasn't able to learn this way the first time, but the Tidyverse didn't even exist back then. Such is life.
The course ends with a k-means example with a deliverable that has been built in R-markdown that is stakeholder ready. This course is literally data science demystified.
In Summary:
Maybe I'm too much of a nerd. But seeing a course this well executed that provides this much value is so worth the investment to me. The speed of the transformation you'll make through taking this course is incredible. If this was available when I first started learning R I would have saved myself so much frustration. Matt Dancho (owner of Business Science) was kind enough to give me a link so that you can receive 15% off of the course. Link
The 15% off is an even better deal if you buy the bundle, but to be honest I haven't taken the 2nd course yet. I certainly will! And I'll definitely write a review afterwards to let you know my thoughts. Here is the link to the bundle: Link
If you're feeling like becoming a data science rockstar, Matt launch a brand new course and you're able to buy the 3 course bundle. The new course is "Predictive Web Applications For Business With R Shiny": Link
If you take the course, please let me know if you thought it was as amazing as I did. You can leave a testimonial in the comment or reach out to me on LinkedIn. I'd love to hear your experience!
Getting into Data Science FAQs
I often see similar questions in my inbox or asked in webinars. I'd like to set the record straight with data. However, I didn't need to start from scratch, there was an excellent article on KD Nuggets by Jeff Hale. Here is the link to his article: "The Most in Demand Skills for Data Scientists". He had already scoured multiple job search site and aggregated data on the demand for different skills for data scientist. I recreated some of his analysis myself, so that I could come up with some points for this article, and to make sure his numbers matched mine before posting. The charts I created below are based on data from searches on indeed.com only. A search for "Data Scientist" was the denominator, and the numerator would be "Data Scientist" plus another term I was looking to see results for. I'm not sure how many job descriptions listed on indeed.com might be duplicates, so this is not gospel, but still interesting.This article will cover a couple of "Frequently Asked Questions" using the methodology above (that was adopted from Jeff).
Questions I'm frequently asked:
Should I learn R or Python?
As a Computer Science major, can I get into data science?
How important is SQL?
Should I learn R or Python?This would most likely be the most frequently asked question (although I've never analyzed the questions that I'm asked). In Jeff's article, you were able to see that Python has the edge in terms of coming up in job listings. I recreated the methodology for myself to look at this a little further.55% of the job listings actually list both tools, as in the company would like to see that you have experience with "Python and/or R". That should make those who have a preference for one tool feel better. If you're looking to pick up either R or Python and you're just getting your hands dirty, I'd suggest python. For listings that only specify one tool, Python is almost 5x more likely to be listed as the tool of choice compared to R.I was happy to see this, as I've mentioned in a number of webinars and comments on social media that it "feels like" Python is slightly more popular. It would have been a bummer if I had been giving misinformation this whole time.
% of Data Science Positions Mentioning a Particular Skill on Indeed.com

Pulled this data by doing a search on indeed.com 11/2018
As a Computer Science major, can I get into data science?I'm always surprised when I see this question, because as someone who's been in the field for a long time, it just seems clear that this is a fantastic skill as your foundation for moving into data science. Data science requires a number of different skills to be successful, and being able to program is definitely one of the core pillars. Analytics and Statistics are coming in first, but Analytics and Statistics could easily be mentioned somewhere in the job description other than specifically where preferred degrees are mentioned. If a job description says "computer science" they're most likely speaking to the degrees they would prefer from candidates. More than 50% of job descriptions mention "computer science". There you have it, a degree in computer science is something "in demand" for getting into data science.
% of Data Science Positions Mentioning a Particular Skill on Indeed.com

Pulled this data by doing a search on indeed.com 11/2018
How important is SQL?I'm frequently asked this question, and I was honestly surprised that SQL came in third behind Python and R in terms of skills. However, 51% of jobs do mention SQL. So it is certainly desired for the majority of positions, but I expected it to rank higher. Is it possible this skill is becoming assumed as a prerequisite? Or are companies figuring that SQL is easily learned and therefore not necessary to list on the job description? I wouldn't mind a job where all the datasets were aggregated for me before data cleaning and applying machine learning, I'm just not sure how many of those jobs exist. If you're a data scientist, and you haven't had to understand relational databases at any point, let me know. I'd love to hear about it.Conclusion:We saw that Python is preferred over R, but that either tool will allow you to apply to the majority of data science jobs in the US. Computer science degrees are a great stepping stone to getting into data science, and the majority of listings will expect you to know SQL.I also want to point out that "communication" was very much in the top list of skills. 46% of job descriptions listed communication in the job description. This means I'll continue to keep writing about how I use softer skills to be effective in my job. I think we sometimes do not talk about communication enough in data science, it's really imperative to delivering models and analysis that are aligned with what the business is looking for. If you'd like to see how Jeff used the data from the job search websites to discuss most in demand skills, here is the link one more time. Link.
Favorite MOOCs for Data Scientists
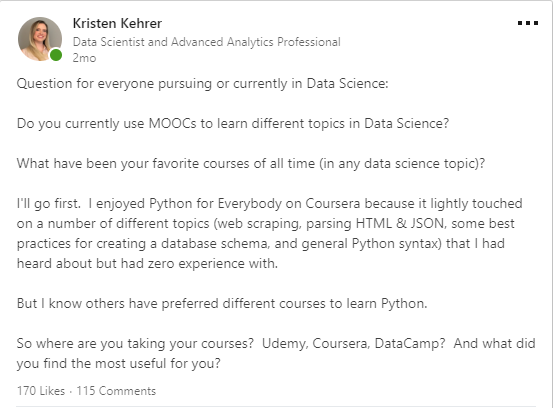
I had asked on LinkedIn recently about everyone’s favorite MOOCs in data science. This post started a lot of great discussion around the courses (and course platforms) that people had experience with. Certain courses were mentioned multiple times and were obviously being recommended by the community.Here was the post:Biggest takeaway:
Anything by Kirill Eremenko or Andrew NG were highly regarded and mentioned frequently.
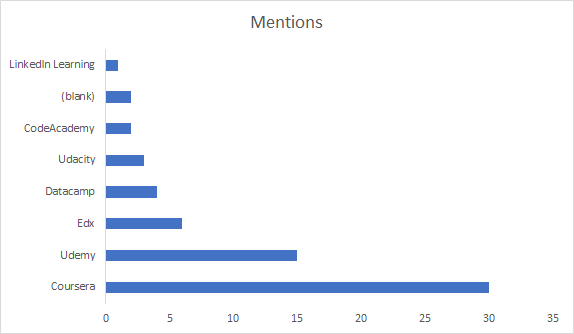
So I decided to revisit this post, and aggregate the information that was being shared so that people who are looking for great courses to build their data science toolkit can use this post as a starting point.You’ll notice that below Coursera had the most mentions, this is mostly driven by Andrew Ng’s Machine learning course (11 mentions for that course alone) and Python For Everybody (6 mentions, also on Coursera). Similarly, Kirill has a number of courses on Udemy that all had multiple mentions, giving Udemy a high number of mentions in the comments as well. (Links to courses are lower in this article).The 2 blanks were due to one specific course. “Statistical Learning in R” it is a Stanford course. Unfortunately I wasn’t able to find it online. Maybe someone can help out by posting where to find the course in the comments?
Update! Tridib Dutta and Sviatoslav Zimine reached out within minutes of this article going live to share the link for the Stanford Course. There was also an Edx course that was recommended that is not currently available, “Learning From Data (Introductory Machine Learning)" so I won’t be linking to that one.
If you’re familiar with MOOCs, a number of platforms allow you to audit the course (i.e. watch the videos and read the materials for free) so definitely check into that option if you’re not worried about getting graded on your quizzes.To make the list, a course had to be recommended by at least 2 people (with the exception of courses covering SQL and foundational math for machine learning, since those didn’t have a lot of mentions, but the topics are pretty critical :).I've organized links to the courses that were mentioned by topic. Descriptions of courses are included when they were conveniently located on the website.
Disclaimer: Some of these links are affiliate links, meaning that at no cost to you, I’ll receive a commission if you buy the course.
SQL:
“Sabermetrics 101: Introduction to Baseball Analytics — Edx”“An introduction to sabermetrics, baseball analytics, data science, the R Language, and SQL.”
“Data Foundations” — Udacity“Start building your data skills today by learning to manipulate, analyze, and visualize data with Excel, SQL, and Tableau.”
Math:
“Mathematics for Machine Learning Specialization” — Coursera“Mathematics for Machine Learning. Learn about the prerequisite mathematics for applications in data science and machine learning.”
Tableau:
“Tableau 10 A-Z: Hands-On Tableau Training for Data Science!” — Udemy (This is a Kirill Eremenko course)
R:
“R Programming” — Coursera “The course covers practical issues in statistical computing which includes programming in R, reading data into R, accessing R packages, writing R functions, debugging, profiling R code, and organizing and commenting R code.”
"R Programming A-Z™: R For Data Science With Real Exercises!" — Udemy (This is a Kirill Eremenko course)"Learn Programming In R And R Studio. Data Analytics, Data Science, Statistical Analysis, Packages, Functions, GGPlot2"
If you're looking for the best R course that has ever existed, read about my favorite R programming course. I wouldn't call it a MOOC, because you have direct access to the instructor through Slack. But if you're serious about learning R, check this out. Link
Python:
“Python for Everybody Specialization” — Coursera“will introduce fundamental programming concepts including data structures, networked application program interfaces, and databases, using the Python programming language.”
Python for Data Science:
“Applied Data Science With Python Specialization” — Coursera
“Python for Data Science” — Edx “Learn to use powerful, open-source, Python tools, including Pandas, Git and Matplotlib, to manipulate, analyze, and visualize complex datasets.”
Machine Learning:
“Machine Learning” — Coursera (This is an Andrew Ng course)
“Machine Learning A-Z™: Hands-On Python & R In Data Science” — Udemy (This is a Kirill Eremenko course)
“Python for Data Science and Machine Learning Bootcamp”— Udemy “Learn how to use NumPy, Pandas, Seaborn , Matplotlib , Plotly , Scikit-Learn , Machine Learning, Tensorflow , and more!”
Deep Learning:
“Deep Learning Specialization” — Coursera (This is an Andrew Ng course)" In five courses, you will learn the foundations of Deep Learning, understand how to build neural networks, and learn how to lead successful machine learning projects. You will learn about Convolutional networks, RNNs, LSTM, Adam, Dropout, BatchNorm, Xavier/He initialization, and more.”No one had anything bad to say about any particular course, however, some people did have preferences in terms of platforms. You can read the original post yourself here.I hope these courses help you widdle down the plethora of options (it’s overwhelming!) and I hope you learn some great new information that you can apply in your career. Happy learning!

Favorite MOOCs for Data Scientists. Data science courses. Data Science resources. Data analysis, data collection, data management, data tracking, data scientist, data science, big data, data design, data analytics, behavior data collection, behavior data, data recovery, data analyst. For more on data science, visit www.datamovesme.com