If you're looking to get a new job in data science, you may want to evaluate the "data driven-ness" of the culture when interviewing. You'll save yourself the potential heartache of watching poorly designed hypothesis tests go out the door after you've informed stakeholders of the pitfalls. We often see tons of articles that discuss what hiring managers are looking in candidates, and candidates are studying and preparing for these questions to put their best foot forward. Interviewing is also a two-way street, there's a ton of information you need to collect for yourself as well.
Let's make sure that candidates are asking the right questions about the state of a company's data, so that they can make a truly informed decision about where they want to work. No one likes surprises. It's not that any of these questions would be a deal breaker necessarily, just make sure you know what you're getting into before you accept an offer.
There are many other questions I'd be looking to ask as well to assess the company culture. As my career has progressed, cultural fit has very much been the deciding factor when considering roles. It is absolutely important to work somewhere that you feel you can be yourself. After all, you spend a hell of a lot of time there. This article is not focused on assessing company culture, but is specifically focused on the questions you might want to ask to assess where a particular company is with their data transformation. By 'data transformation' I'm not talking about taking the natural log of one of your variables. I'm talking about the journey a company goes through while striving to modernize their approach to leveraging their data. Companies often start on a journey to become more data driven, and that's great! But it's also possible that you don't want to take a new job and find that all of their data lives in Excel spreadsheets rather than in a database (this exists folks).
Ask: About the relationship with stakeholders. Who has the decision rights on final test design or analysis? Do stakeholders often make decisions that are counter to analysis?
I ask about who has decision right on analytics initiatives. Are analytics and their stakeholders thought partners who collaborate effectively? Or can raising a ticket for analytics feel like asking for food from a short-order cook?Would you like t-tests with that? With work, this relationship dynamic can obviously be changed. There's also the case where a position wouldn't have as much communication with stakeholders as typical data analyst and data scientist roles, there is always room for variability.
It is certainly worth clarifying in the interview whether you can expect your thoughts on methodology to be valued on day 1, or if there is significant work to be done to achieve that. It's probably important you understand the dynamics of this relationship before taking a role.
I also want to note, it's perfectly acceptable for an organization to make strategic decisions. These would be decisions counter to any analysis performed and you decide to do them anyways. Though I do believe that if that is the case your analytics resources should be focused on higher value initiatives and not on items where the final decision has already been made.
I Ask: About the state of self service tools for stakeholders. Are dashboards currently in place? Is there a lot of ad-hoc one off analysis (or are you working on high-value big impact projects)?
Do you love building dashboards? I enjoy making a nice dashboard occasionally, but if the stakeholders don't already have self-service data access, there's a high likelihood that this is what you'd be doing, and it's nice to know this in advance. Although I actually do enjoy building dashboards, the concern I have (and have experienced first hand) is when stakeholders cannot access the level of data they need, these asks now become "ad hoc analysis". These questions can be fun, it feels good to help someone find an answer, but they're typically not higher value questions. The time you help Mary from Marketing look at the price distribution of the cheapest items in the product catalog is not going to earn a spot on your resume. All positions will have ad-hoc queries, but you might want to make sure that ad hoc requests are a piece of the gig and not the majority of the gig. Ensuring that your future stakeholders can already access the data they need to perform their job will reduce the likelihood of constant ad-hoc requests.
Ask: About data governance. Do teams across the organization all have the same understood definition of the same fields or metrics? Or will you get a different answer for certain metrics depending on which department you ask?
Ever complete an analysis only to spend the next week digging into why your number is different from Jimmy's? It's not fun. When there's no governance in place, trying to get your numbers to foot with someone else can also be common. Being a data steward for tables leveraged by analytics was probably not the most exciting part of my job, but I'd take that anytime if the alternative was lacking data governance. When there are too many questions around how things are calculated, it's easier for people to change their mind about how things are calculated (to support their interests). My wish for you is a job where the data is correct and metrics are well defined.
Ask: Are they able to understand (or have data easily accessible) that would allow you to get at the full journey of the customer from first touch points all the way through attrition??
If you don't understand the customer journey, it's possible you're performing analysis on a disjointed view rather than the whole picture. Once you have the full picture of the customer journey, your previous beliefs, stories, and analysis might not hold up. Luckily, performing this analysis would lead to a ton of juicy insights and could be a ton of fun. It's also possible, that the organization you're interviewing with doesn't have the data to make this analysis possible. For instance, I've worked with companies that did not have website click data available. In many scenarios, it's hard to build predictive models without this, so much of what we care about in e-commerce is often tied to this behavior. Asking about the customer journey is my way of starting a dialogue about what data might be missing or hard to access. There's often a number of data sources that need to be integrated to go all the way from acquisition (and the channel that they came in on) all the way to churn. There's sales data, website click data, purchase data, customer service data, lots of data. This is all about having the relevant information you need to make an informed decision.
summary:
You can obviously still join an organization that has less than stellar answers to these questions. No one (or company) is perfect! My hope is you'll at least have a real good idea of what your job might look like and the challenges you might face if you choose to work for that company. The questions here are often the same problems we read about in blogs currently. Many data companies are still working their way through these! Once you take a job, remember to keep asking questions! I've written another post about asking great questions as a data scientist, you can check it out here.
Would love to hear your thoughts on questions that help you assess the current state of data at an organization.
I bet you're searching the internet for a fantastic reference to help you get ready for your SQL interview. You've landed in the right place.
Let's jump right in and get started. I have a SQL browser available for you to use here: Show me the data
The data is fictitious, but extensive and useful for writing queries.
You can use this browser to answer all of the questions below. When you're done, if you weren't able to answer a couple of the questions, you can give me your email address in the email form near the bottom of this article and I'll send you the query solutions.
This article is designed to help you with "white boarding" SQL questions. We're not going to cover any theory here. Just a bunch of questions and how to answer them leveraging SQL.
I wish you a ton of luck on your interview, I hope it results in an offer! If you're looking to further your SQL skills for data science, I have also created the ultimate course in SQL for data science. We cover tons of material that you won't see here, because feature engineering, handling NULLs, working with datetimes, etc., is not typically part of the interview. But if you want to really hit the ground running at your new job, I'd highly suggest this course. It's free and you can find it here
SQL Questions using just the select statement:
Write a query to determine the number of rows in the customer table. Answer: 351,962
What was the maximum commission paid in the customer table? The median? Answer: Max -$10,295, Average -$66.30
Write a query to that returns the customer_id, business_type and Country from the customer table.
SQL Questions using a where statement:
How many customers do we have "has_instagram" information for in the customer table? i.e. - How many rows are not NULL? Answer: 128,449
How many customers have a "First_conversion_date" greater than 1/1/2016 in the customer table? Answer: 54,397
SQL Question using a group by statement:
How many customers have "has_facebook" =1 in the customer table? Use a group by statement. Answer: 60,894
SQL Question using a group by and order statement:
Which state has the most customers? How many customers live in that state in the customer table? Answer: California, 43,736 customers
SQL Question using a having statement and subquery:
Using the billedservices table, how many customers had more than 1 billed service? Use a subquery to answer this question. Answer: 44
SQL Question requiring a join:
How many customers from OUTSIDE the United States have an entry in the billed services table? Answer: 89
In an interview, they'll typically place two or three pieces of paper up on the whiteboard. This will have your data. Obviously, this means that the data you'll be working with is much smaller.
Take home tests are typically much more difficult than what was covered here. During an in-person interview, they'll typically only have 30 minutes to an hour to assess your SQL knowledge. Most often, they just want to know that if you have SQL listed on your resume, that you can write some simple queries like up above.
I've never personally been asked to whiteboard the solution for creating a table, updating a column, etc., but obviously any SQL questions are fair game.
If you had no difficulty answering these questions, you're likely to do fine on your SQL interview.
Want to further your SQL skills for data science? Check out the Ultimate SQL for Data Science course.
Looking for the solutions to the questions above? I'll send them directly to your inbox :)
PSA: if you're still showing data in pie charts, stop.
Companies love to exclaim "we're data driven". There are obvious benefits to being a data driven organization, and everyone nowadays has more data than they can shake a stick at. But what exactly does an organization need to be "data driven"?
Just because you have a ton of data, and you've hired people to analyze it or build models, does that make you data driven? No. That's not enough.
Although we think a lot about data and how to use it. Being data driven needs to be a priority at the executive level and become part of the culture of the organization; more so than simply having a team with the necessary capabilities.
Here are the baseline qualities that I believe are necessary to be effective in your "data driven-ness". Now I'm making up words.
To be data driven:
Test design and analysis is owned by analytics/data science teams.
Dashboards are already in place that give stakeholders self-serve access to key metrics. (Otherwise you'll have low value ad-hoc requests to pull these metrics, and it'll be a time sink.)
Analytics/Data Science teams collaborate with the business to understand the problem and devise an appropriate methodology.
Data governance and consistent usage of data definitions across departments/the organization.
You have a data strategy.
You'll notice that there is a lack of fancy hype buzzwords above. You don't need to be "leveraging AI" or calling things AI that are in fact hypothesis tests, business logic, or simple regression.
I don’t believe fancy models are required to consider yourself data driven. A number of the points listed above are references to the attitudes of the organization and how they partner and collaborate with analytics and data science teams . I love building models as much as the next data scientist, but you can't build next level intelligence on a non-existent foundation.
To clarify, I'm not saying every decision in the organization needs to be driven by data to be data driven. In particular, if you're going to make a strategic decision regardless of the results of a test or analysis, then you should skip doing that test. I'm a big advocate of only allocating the resources to a project if you're actually going to USE the results to inform the decision.
Let's take a look at the points from above.
Test design and analysis is owned by analytics/data science teams:
Although data science and analytics teams often come up with fantastic ideas for testing. There are also many ideas that come out of a department that is not in analytics. For instance, in eCommerce the marketing team will have many ideas for new offers. The site team may want to test a change to the UI. This sometimes gets communicated to the data teams as "we'd like to test "this thing, this way". And although these non analytics teams have tremendous skill in marketing and site design, and understand the power of an A/B test; they often do not understand the different trade-offs between effect size, sample size, solid test design, etc.
I've been in the situation more than once at more than one company where I'm told "we understand your concerns, but we're going to do it our way anyways." And this is their call to make, since in these instances those departments have technically "owned" test design. However, the data resulting from these tests is often not able to be analyzed. So although we did it their way, the ending result did not answer any questions. Time was wasted.
Dashboarding is in place:
This is a true foundational step. So much time is wasted if you have analysts pulling the same numbers every month manually, or on an ad-hoc basis. This information can be automated, stakeholders can be given a tour of the dashboards, and then you won't be receiving questions like "what does attrition look like month over month by acquisition channel?" It's in the dashboard and stakeholders can look at it themselves. The time saved can be allocated to diving deep into much more interesting and though provoking questions rather than pulling simple KPIs.
Analytics/Data Science teams collaborate with the business on defining the problems:
This relationship takes work, because it is a relationship. Senior leaders need to make it clear that a data-driven approach is a priority for this to work. In addition, analytics often needs to invite themselves to meetings that they weren't originally invited to. Analytics needs to be asking the right questions and guiding analysis in the right direction to earn this seat at the table. No relationship builds over night, but this is a win-win for everyone. Nothing is more frustrating than pulling data when you're not sure what problem the business is trying to solve. It's Pandoras Box. You pull the data they asked for, it doesn't answer the question, so the business asks you to pull them more data. Stop. Sit down, discuss the problem, and let the business know that you're here to help.
Data governance and consistent usage of data definitions across departments/the organization:
This one may require a huge overhaul of how things are currently being calculated. The channel team, the product team, the site team, other teams, they may all be calculating things differently if the business hasn't communicated an accepted definition. These definitions aren't necessarily determined by analytics themselves, they're agreed upon. For an established business that has done a lot of growing but not as much governance can feel the pain of trying to wrangle everyone into using consistent definitions. But if two people try to do the same analysis and come up with different numbers you've got problems. This is again a foundation that is required for you to be able to move forward and work on cooler higher-value projects, but can't if you're spending your time reconciling numbers between teams.
You have a data strategy:
This data strategy is going to be driven by the business strategy. The strategy is going to have goals and be measurable. The analyses you plan for has a strong use case. People don't just come out of the woodwork asking for analysis that doesn't align to the larger priorities of the business. Things like "do we optimize our ad spend or try to tackle our retention problem first?" comes down to expected dollars for the business. Analytics doesn't get side-tracked answering lower value questions when they should be working on the problems that will save the business the most money.
In Summary:
I hope you found this article helpful. Being data driven will obviously help you to make better use of your data. However, becoming data driven involves putting processes into place and having agreement about who owns what at the executive level. It's worth it, but it doesn't happen over night. If you're not yet data driven, I wish you luck on your journey to get there. Your analysts and data scientists will thank you.
If you have suggestions on what else is required to be data driven, please let me know your thoughts!
Asking questions can sometimes seem scary. No one wants to appear "silly." But I assure you:
You're not silly.
It's way more scary if you're not asking questions.
Data Science is a constant collaboration with the business and a series of questions and answers that allow you to deliver the analysis/model/data product that the business has in their head.
Questions are required to fully understand what the business wants and not find yourself making assumptions about what others are thinking.
Asking the right questions, like those you identified here is what separate Data Scientists that know 'why' from folks that only know what (tools and technologies).
-Kayode Ayankoya
We're going to answer the following questions:
Where do we ask questions?
What are great questions?
I had posted on LinkedIn recently about asking great questions in data science and received a ton of thought provoking comments. I will add a couple of my favorite comments/quotes throughout this article.
Where do we ask questions?
Basically every piece of the pipeline can be expressed as a question:
And each of these questions could involve a plethora of follow up questions.
To touch the tip of the iceberg, Kate Strachnyi posted a great assortment of questions that we typically ask (or want to consider) when scoping an analysis:
Few questions to ask yourself:
How will the results be used? (make business decision, invest in product category, work with a vendor, identify risks, etc)
What questions will the audience have about our analysis? (ability to filter on key segments, look at data across time to identify trends, drill-down into details, etc)
How should the questions be prioritized to derive the most value?
Who should be able to access the information? think about confidentiality/ security concerns
Do I have the required permissions or credentials to access the data necessary for analysis?
What are the different data sources, which variables do I need, and how much data will I need to get from each one?
Do I need all the data for more granular analysis, or do I need a subset to ensure faster performance?
Questions you'd ask internally on the data science/analytics team.
Any of the questions above could yield a variety of answers, so it is imperative that you're asking questions. Just because you have something in your mind that is an awesome idea for approaching the problem, does not mean that other people don't similarly have awesome ideas that need to be heard an discussed. At the end of the day, data science typically functions as a support function to other areas of the business. Meaning we can't just go rogue.
In addition to getting clarification and asking questions of stakeholders of the project, you'll also want to collaborate and ask questions of those on your data science team.
Even the most seasoned data scientist will still find themselves creating a methodology or solution that isn't in their area of expertise or is a unique use case of an algorithm that would benefit from the thoughts of other data subject matter experts. Often times the person listening to your proposed methodology will just give you the thumbs up, but when you've been staring at your computer for hours there is also a chance that you haven't considered one of the underlying assumptions of your model or you're introducing bias somewhere. Someone with fresh eyes can give a new perspective and save you from realizing your error AFTER you've presented your results.
Keeping your methodology a secret until you deliver the results will not do you any favors. If anything, sharing your thoughts upfront and asking for feedback will help to ensure a successful outcome.
What are great questions?
Great questions are the ones that get asked. However, there is an art and science to asking good questions and also a learning process involved. Especially when you're starting at a new job, ask everything. Even if it's something that you believe you should already know, it's better to ask and course-correct, than to not ask. You could potentially lose hours working on an analysis and then have your boss tell you that you misunderstood the request.
It is helpful to also pose questions in a way that requires more than a "yes/no" response, so you can open up a dialogue and receive more context and information.
How we formulate the questions is also very important. I've often found that people feel judged by my questions. I have to reassure them that all I want is to understand how they work and what are their needs and that my intention is not to judge them or criticize them.
-Karlo Jimenez
I've experienced what Karlo mentioned myself. Being direct can sometimes come off as judgement. We definitely need to put on our "business acumen" hats on to the best of our ability to come across as someone who is genuinely trying to understand and deliver to their needs. I've found that if I can pose the question as "looking for their valuable feedback", it's a win-win for everyone involved.
As you build relationships with your team and stakeholders, this scenario is much less likely to occur. Once everyone realizes your personality and you've built a rapport, people will expect your line of questioning.
Follow up questions, in its various forms, are absolutely critical. Probing gives you an opportunity to paraphrase the ask and gain consensus before moving forward.
-Toby Baker
Follow-up questions feel good. When a question prompts another question you feel like you're really getting somewhere. Peeling back another layer of the onion if you will. You're collaborating, you're listening, you're in the zone.
In Summary
The main takeaway here is that there are a TON of questions you need to ask to effectively produce something that the business wants. Once you start asking questions, it'll become second nature and you'll immediately see the value and find yourself asking even more questions as you gain more experience.
Questioning has been instrumental to my career. An additional benefit is that I've found my 'voice' over the years. I feel heard in meetings and my opinion is valued. A lot of this growth has come from getting comfortable asking questions and I've also learned a ton about a given business/industry through asking these questions.
I've learned a lot about diversity of viewpoints and that people express information in different ways. This falls under the "business acumen" piece of data science that we're not often taught in school. But I hope you can go forward and fearlessly ask a whole bunch of questions.
I'm writing this article so that a year from now when I've completely forgotten how cool 2018 was, I can look back on this post. I'm literally floored by all that transpired this year, here is a small snapshot in chronological-ish order:
I started a new position in January 2018 as a Senior Data Scientist at Constant Contact. I've been fortunate to work on interesting projects throughout the year that have often served as inspiration for blog posts.
I launched my first blog article (ever) in March of 2018. This was originally on the domain kristenkehrer.com which is no longer live. This first blog article was rejected by Towards Data Science on Medium. My 2nd blog article was accepted, and now I cross-post most of my articles on TDS. (I've said this before, but if you're blogging and you get rejected, just keep coming back ;)
I spoke on a panel at Hult International Business School on how to get into data science.
I launched datamovesme.com in July after banging my head against the wall trying to figure out Wordpress. I made this move because I knew I'd like to eventually launch a course on my own hosted site and the website builder I was using for kristenkehrer.com would not allow me to do that. In addition, my previous website was never going to rank for SEO.
I spoke with Mike Delgado at Experian on the DataTalk Podcast. So many laughs, fun, and data science in this episode, give it a listen :)
In the end of August I launched my first ever online course "Up-Level Your Data Science Resume." It has helped so many people effectively market themselves and land jobs in data science positions. When people email me to tell me that they have found a job it literally brightens my week.
I was invited to join the YouTube channel Data Science Office Hours with Sarah Nooravi, Eric Weber, Tarry Singh, Kate Strachnyi, Favio Vazquez, Andreas Kretz and newly added Matt Dancho. It's given me the opportunity to create friendships with these wonderful and intelligent people who are all giving back to the community. I want to give a special shout out to Mohamed Mokhtar for creating wonderful posters for office hours. You can check out previous episodes on the Data Science Office Hours YouTube channel (link above).
August 22nd was Favio Vazquez and I launched Data Science Live. We've had incredible guests, take questions from the community, and generally just talk about important topics in data science in industry. We already have some amazing guests planned for 2019 that I cannot wait to hear their perspective and learn from them.
I spoke at Data Science Go in October and had the time of my life. It was basically the king of data parties. I'm grateful to Kirill Eremenko and his team for giving me the opportunity. My talk was around how to effectively communicate complex model output to stakeholders. I went through 4 case studies and demonstrated how I've evolved through time to position myself as a though partner with stakeholders. I also had the opportunity to speak on a panel discussing women in data and diversity. I love sharing my experience as a woman in data and also how I'm able to be an ally and advocate for those who aren't always heard at work.
I was also on the SuperDataScience Podcast in November. Getting to chat 1-on-1 with Kirill was fantastic. He has great energy and was a joy to speak with.
In November I was #8 LinkedIn Top Voices 2018 in Data Science and Analytics. That still seems a little surreal. Then in December LinkedIn sent me a gift after I wrote an article about the wonderful data science community on LinkedIn. That's also pretty nuts.
I picked up a part-time job as a Teaching Assistant for an Applied Data Science online course through Emeritus. Being at DSGO made me think of how I'm contributing to the community, and having the opportunity to help students learn data science has given me extra purpose while helping to keep my skills sharp. It's really a win all around.
It's been a jam-packed year and at times a little hectic between the 9-5, my two young children, and all the fun data science related activities I've participated in. Luckily I have a husband who is so supportive; all of these extracurricular activities wouldn't be possible without him.
Looking to 2019:
I've set some big goals for myself and already have a number of conferences I'll be speaking at in the calendar. I can't wait to share some of these exciting new ventures in the New Year. I wish you a wonderful holiday and can't wait to see and engage with you in 2019.
If you're new to the field of Data Science, I wanted to offer some tips on how to transition from presentations you gave in academia to creating effective presentations for industry.Unfortunately, if your background is of the math, stats, or computer science variety, no one probably prepared you for creating an awesome data science presentations in industry. And the truth is, it takes practice. In academia, we share tables of t-stats and p-values and talk heavily about mathematical formulas. That is basically the opposite of what you'd want to do when presenting to a non-technical audience.If your audience is full of a bunch of STEM PhD's then have at it, but in many instances we need to adjust the way we think about presenting our technical material.I could go on and on forever about this topic, but here we'll cover:
Talking about model output without talking about the model
Painting the picture using actual customers or inputs
Putting in the Time to Tell the Story
Talking about model output without talking about the modelCertain models really lend themselves well to this. Logistic regression, decision trees, they're just screaming to be brought to life.You don't want to be copy/pasting model output into your data science presentations. You also don't want to be formatting the output into a nice table and pasting it into your presentation. You want to tell the story and log odds certainly are not going to tell the story for your stakeholders.A good first step for a logistic regression model would just be to exponentiate the log odds so that you're at least dealing in terms of odds. Since this output is multiplicative, you can say:"For each unit increase of [variable] we expect to see a lift of x% on average with everything else held constant."So instead of talking about technical aspects of the model, we're just talking about how the different drivers effect the output.
We could, however, take this one step further.
Using Actual Customers to Paint the Picture: I love using real-life use cases to demonstrate how the model is working. Above we see something similar to what I presented when talking about my seasonality model. Of course I changed his name for this post, but in the presentation I would talk about this person's business, why it's seasonal, show the obvious seasonal pattern, and let them know that the model classified this person as seasonal. I'm not talking about fourier transforms, I'm describing how real people are being categorized and how we might want to think about marketing to them. Digging in deep like this also helps me to better understand the big picture of what is going on. We all know that when we dig deeper we see some crazy behavioral patterns.Pulling specific customers/use cases works for other types of models as well. You built a retention model? Choose a couple people with a high probability of churning, and a couple with a low probability of churning and talk about those people."Mary here has been a customer for a long time, but she has been less engaged recently and hasn't done x, y, or z (model drivers), so the probability of her cancelling her subscription is high, even though customers with longer tenure are usually less likely to leave.
Putting in the Time to Tell the Story: As stated before, it takes some extra work to put these things together. Another great example is in cluster analysis. You could create a slide for each attribute, but then people would need to comb through multiple slides to figure out WHO cluster 1 really is vs. cluster 2, etc. You want to aggregate all of this information for your consumer. And I'm not above coming up with cheesy names for my segments, it just comes with the territory :).It's worth noting here that if I didn't aggregate all this information by cluster, I also wouldn't be able to speak at a high level about who was actually getting into these different clusters. That would be a large miss on my behalf, because at the end of the day, your stakeholders want to understand the big picture of these clusters.Every analysis I present I spend time thinking about what the appropriate flow should be for the story the data can tell.
I might need additional information like market penetration by geography, (or anything, the possibilities are endless). The number of small businesses by geography may not have been something I had in my model, but with a little google search I can find it. Put in the little extra work to do the calculation for market penetration, and then create a map and use this information to further support my story. Or maybe I learn that market penetration doesn't support my story and I need to do more analysis to get to the real heart of what is going on. We're detectives. And we're not just dealing with the data that is actually in the model. We're trying to explore anything that might give interesting insight and help to tell the story. Also, if you're doing the extra work and find your story is invalidated, you just saved yourself some heartache. It's way worse when you present first, and then later realize your conclusions were off. womp womp.
Closing comments: Before you start building a model, you were making sure that the output would be actionable, right? At the end of your presentation you certainly want to speak to next steps on how your model can be used and add value whether that's coming up with ideas on how you can communicate with customers in a new way that you think they'll respond to, reduce retention, increase acquisition, etc. But spell it out. Spend the time to come up with specific examples of how someone could use this output.I'd also like to mention that learning best practices for creating great visualizations will help you immensely.
There are two articles by Kate Strachnyi that cover pieces of this topic. You can find those articles here and here. If you create a slide and have trouble finding what the "so what?" is of the slide, it probably belongs in the appendix. When you're creating the first couple decks of your career it might crush you to not include a slide that you spent a lot of time on, but if it doesn't add something interesting, unfortunately that slide belongs in the appendix.I hope you found at least one tip in this article that you'll be able to apply to your next data science presentation. If I can help just one person create a kick-ass presentation, it'll be worth it.
Holy Moly. I started blogging in March and it has opened my eyes.I want to start off by saying that I didn't magically come up with this idea of blogging on my own. I noticed my friend Jonathan Nolis becoming active on LinkedIn, so I texted them to get the scoop. They told me to start a blog and jokingly said "I'm working on my #brand". I'm the type of person to try anything once, plus I already owned a domain name, had a website builder (from working at Vistaprint), and I have an email marketing account (because I work for Constant Contact). So sure, why not? If you're thinking about starting a blog. Know that you do not need to have a bunch of tools already at your disposal. If needed, you can create articles on LinkedIn or Medium. There are many options to try before investing a penny . . . but of course, you can go ahead and create your own site.
I have since moved to self-hosted Wordpress. I've fallen in love with blogging, and Wordpress lets me take advantage of lots of extra functionality.With my first post, my eyes started to open up to all the things that other members of the Data Science community were doing. And honestly, if you had asked me about who I most looked up to in Data Science prior to starting my blog, I'd probably just rattle off people who have created R packages that have made my life easier, or people who post a lot of answers to questions on Stack Overflow. But now I was paying attention on LinkedIn and Twitter, and seeing the information that big data science influencers like Kirk Borne, Carla Gentry, Bernard Marr, and many others (seriously, so many others) were adding to the community.
I also started to see first hand the amount of people that were studying to become a data scientist (yay!). Even people who are still in school or very early in their careers are participating by being active in the data science community. (You don't need to be a pro, just hop in). If you're looking for great courses to take in data science, these ones have been highly recommended by the community here.I've paid attention to my blog stats (of course, I'm a data nerd), and have found that the articles that I write that get the biggest response are either:
Articles on how to get into data science
Coding demos on how to perform areas of data science
But you may find that something different works for you and your style of writing. I don't just post my articles on LinkedIn. I also post on Twitter, Medium, I send them to my email list, and I put them on Pinterest. I balked when someone first mentioned the idea of Pinterest for data science articles. It's crazy, but Pinterest is the largest referrer of traffic to my site. Google Analytics isn't lying to me.
I've chatted with so many people in LinkedIn messaging, I've had the opportunity to speak with and (virtually) meet some awesome people who are loving data and creating content around data science. I'm honestly building relationships and contributing to a community, it feels great. If you're new to the "getting active in the data science community on LinkedIn" follow Tarry Singh, Randy Lao, Kate Strachnyi, Favio Vazquez, Beau Walker, Eric Weber, and Sarah Nooravi just to name a few. You'll quickly find your tribe if you put yourself out there. I find that when I participate, I get back so much more than I've put in.Hitting "post" for the very first time on content you've created is intimidating, I'm not saying that this will be the easiest thing you ever do. But you will build relationships and even friendships of real value with people who have the same passion. If you start a blog, I look forward to reading your articles and watching your journey.
Building community in data science through blogging. Data analysis, data collection , data management, data tracking, data scientist, data science, big data, data design, data analytics, behavior data collection, behavior data, data recovery, data analyst. For more on data science, visit www.datamovesme.com
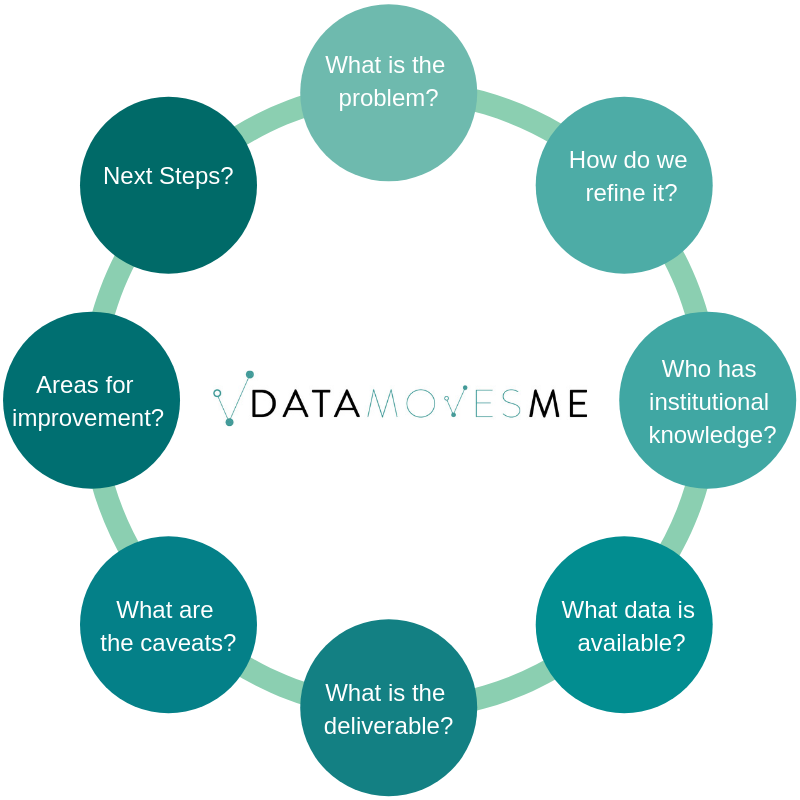
I spoke in a Webinar recently about how to get into Data Science. One of the questions asked was "What does a typical day look like?" I think there is a big opportunity to explain what really happens before any machine learning takes place for a large project. I've previously written about thinking creatively for feature engineering, but there is even more to getting ready for a data science project, you need to get buy in on the project from other areas of the business to ensure you're delivery insights that the business wants and needs.It may be that the business has a high priority problem for you to solve, but often you'll identify projects with a high ROI and want to show others the value you could provide if you were given the opportunity to work on the project you've come up with.The road to getting to the machine learning algorithm looks something like:
Plenty of meetings
Data gathering (often from multiple sources)
Exploratory data analysis
Feature engineering
Researching the best methodology (if it's not standard)
Machine learning
We're literally going to cover the 1st bullet here in this article. There are a ton of meetings that take place before I ever write a line of SQL for a big project. If you read enough comments/blogs about Data Science, you'll see people say it's 90% data aggregation and 10% modeling (or some other similar split), but that's also not quite the whole picture. I'd love for you to fully understand what you're signing up for when you become a data scientist.
Meetings: As I mentioned, the first step is really getting buy in on your project. It's important that as an Analytics department, we're working to solve the needs of the business. We want to help the rest of the business understand the value that a project could deliver, through pitching the idea in meetings with these stakeholders. Just to be clear, I'm also not a one woman show. My boss takes the opportunity to talk about what we could potentially learn and action on with this project whenever he gets the chance (in additional meetings). After meetings at all different levels with all sorts of stakeholders, we might now have agreement that this project should move forward.
More Meetings: At this point I'm not just diving right into SQL. There may be members of my team who have ideas for data that I'm not aware of that might be relevant. Other areas of the business can also help give inputs into what variables might be relevant (they don't know they database, but they have the business context, and this project is supposed to SUPPORT their work).There is potentially a ton of data living somewhere that has yet to be analyzed, the databases of a typical organization are quite large, unless you've been at a company for years, there is most likely useful data that you are not aware of.
The first step was meeting with my team to discuss every piece of data that we could think of that might be relevant. Thinking of things like:
If something might be a proxy for customers who are more "tech savvy". Maybe this is having a business email address as opposed to a gmail address (or any non-business email address), or maybe customers who utilize more advanced features of our product are the ones we'd consider tech savvy. It all depends on context and could be answered in multiple ways. It's an art.
Census data could tell us if a customers zip code is in a rural or urban area? Urban or rural customers might have different needs and behave differently, maybe the extra work to aggregate by rural/urban isn't necessary for this particular project. Bouncing ideas off other and including your teammates and stakeholders will directly impact your effectiveness.
What is available in the BigData environment? In the Data Warehouse? Other data sources within the company. When you really look to list everything, you find that this can be a large undertaking and you'll want the feedback from others.
After we have a list of potential data to find, then the meetings start to help track all that data down. You certainly don't want to reinvent the wheel here. No one gets brownie points for writing all of the SQL themselves when it would have taken you half the time if you leveraged previously written queries from teammates. If I know of a project where someone had already created a few cool features, I email them and ask for their code, we're a team. For a previous project I worked on, there were 6 different people outside of my team that I needed to connect with who knew these tables or data sources better than members of my team. So it's time to ask those other people about those tables, and that means scheduling more meetings.
Summary: I honestly enjoy this process, it's an opportunity to learn about the data we have, work with others, and think of cool opportunities for feature engineering. The mental picture is often painted of data scientists sitting in a corner by themselves, for months, and then coming back with a model. But by getting buy in, collaborating with other teams, and your team members, you can keep stakeholders informed through the process and feel confident that you'll deliver what they're hoping. You can be a thought partner that is proactively delivering solutions.
Tips for starting a data science project. Data analysis, data collection , data management, data tracking, data scientist, data science, big data, data design, data analytics, behavior data collection, behavior data, data recovery, data analyst. For more on data science, visit www.datamovesme.com.
Last week I had the opportunity to attend Open Data Science Conference (ODSC) in Boston. It was awesome to see people just walking around who I had previously read about or I'm following them on twitter. It was even nicer to meet some of these people, and I was amazed at how friendly everyone was.
Of course you can't attend everything at a conference like this, at one point there was 11 different sessions going on at once. It was really difficult to determine which sessions to attend given the number of great options, but I tried to align the information I'd be consuming closely with what I'd be able to bring back to my day job and implement.
In this article I'll cover some learnings/ favorite moments from:
one of the trainings
a couple different workshops
the sweet conference swag
mention one of the keynotes
Trainings:My original plan was to take an R training in the morning on Tuesday and take a Python training that afternoon. However, what really happened was I went to the R training in the morning, this training left me feeling super jazzed about R, and so I ended up going to another R training that afternoon (instead of the Python training I had originally planned on). The morning R training I took was "Getting to grips with the tidyverse (R)" given by Dr. Colin Gillespie. This was perfect, because I had been struggling with dplyr (an R package) the night previously, and this training went through parts of dplyr with great explanations along the way. Colin also showed us how to create plots using the package "Plotly". This was my first time creating an interactive graph in R. Easy to use, and super cool. He was also nice enough to take a look at the code I was currently working on, I definitely appreciated this.
The afternoon R training I attended was given by Jared Lander entitled "Intermediate RMarkdown in Shiny". It was my first introduction to Shiny. I had heard about it, but had never ventured to use it, now I don't know what I was waiting for. If you ever have the opportunity to hear Jared speak, I found him incredibly entertaining, and he explained the material clearly, making it super accessible. I like to think Jared also enjoyed my overly animated crowd participation.
Workshops:
On Thursday I attended "Uplift Modeling and Uplift Prescriptive Analytics: Introduction and Advanced Topics" by Victor Lo, PHD. This information really resonated with me. Dr. Lo spoke about the common scenario in Data Science where you'll build a model to try and predict something like customer attrition. You'd maybe take the bottom three deciles (the people with the highest probability of cancelling their subscription, and do an A/B test with some treatment to try and encourage those customers to stay.
In the end, during analysis, you'd find that you did not have a statistically significant lift in test over control with the usual methods. You end up in a situation where the marketers would be saying "hey, this model doesn't work" and the data scientist would be saying "what? It's a highly predictive model". It's just that this is not the way that you should be going about trying to determine the uplift. Dr. Lo spoke about 3 different methods and showed their results.
These included:
Two Model Approach
Treatment Dummy Approach
Four Quadrant Method
Here is the link to his ODSC slides from 2015 where he also covered these 3 models (with similar slides): here
I've experienced this scenario before myself, where the marketing team will ask for a model and want to approach testing this way. I'm super excited to use these methods to determine uplift in the near future.
Another workshop I attended was "R Packages as Collaboration Tools" by Stephanie Kirmer (slides). Stephanie spoke about creating R packages as a way to automate repeated tasks. She also showed us how incredibly easy it is to take your code and make it an R package for internal use. Here is another case that is applicable currently at my work. I don't have reports or anything that is due on a regular cadence, but we could certainly automate part of the test analysis process, and there are currently ongoing requests asked of Analytics in our organization that could be automated. Test analysis is done in a different department, but if automated, this would save time on analysis, reduce potential for human error in test analysis, and free up bandwidth for more high value work.SWAG:
Although conference swag probably doesn't really need a place in this article, Figure Eight gave out a really cool little vacuum that said "CLEAN YOUR DATA". I thought I'd share a picture with you. Also, my daughter loved the DataRobot stickers and little wooden robots they gave out. She fashioned the sticker around her wrist and wore it as a bracelet. 3 year olds love conference swag:
Keynote:The keynote was Thursday morning. I LOVED the talk given by Cathy O'Neil, a link to her TED talk is here. She spoke about the importance of ethics in data science, and how algorithms have to use historical data, therefore, they're going perpetuate our current social biases. I love a woman who is direct, cares about ethics, and has some hustle. Go get em' girl. I made sure to get a chance to tell her how awesome her keynote was afterwards. And of course I went home and bought her book "Weapons of Math Destruction". I fully support awesome.Summary:I had an incredible time at the ODSC conference. Everyone was so friendly, my questions were met with patience, and it was clear that many attendees and speakers had a true desire to help others learn. I could feel the sense of community. I highly suggest that if you every get the opportunity to attend, go! I am returning to work with a ton of new information that I can begin using immediately at my current job, it was a valuable experience. I hope to see you there next year.
I’ve read a number of articles stating how hard it was to get into Analytics and Data Science. This hasn’t been my experience, so I wanted to share. We’ll look at interviewing, the tools I currently use, what parts of industry I wasn’t prepared for in school, and what my career trajectory has looked like. But not in that particular order.It probably makes sense to quickly recap my education before we dive in!
In 2004 — Completed a BS in Mathematics from UMASS Dartmouth
Had a 3.8 GPA in my major
Took FORTRAN while there (wasn’t good at it)
No internships
I LOVE math, and loved my time in school
Honestly, not much worth noting 2004–2007. I was “finding myself,” or something.In 2007 — Started MS in Statistics at WPI Part-Time while working for Caldwell Banker Real Estate Brokerage.
The “Housing bubble” burst (the kick-off for the Great Recession), and at the same time I was lucky to be offered a Teaching Assistantship at WPI.
Moved to Worcester and finished my MS Full-Time (Finished 2010)
Used SAS & R in classes
Still no internships (economy was bad, and I had yet to learn a ton about job searching, networking, and didn’t make use of the career center)
Thought I wanted to teach at a Community College, but two Professors asked if I’d be interested in interviewing at a local utility company (and the company happened to be 3 miles from my parents house).
I interviewed at that one company and took that job.At my first post-grad school industry job, NSTAR (now Eversource) I was a Forecast Analyst using Econometric Time-Series analysis to forecast gas and electric load (read — how much gas and electricity we need to service the customers).
Everyday I was building ARIMA models, using various statistical tests to test for structural breaks in the data, unit root tests for stationarity, and I wrote a proof to explain to the Department of Public Utilities why my choice of t-stats with a value > 1 (even though the p-value might be 0.2) were beneficial to have in the model for forecasting purposes.
I built cool Neural Nets to forecast hourly electric load. This methodology made sense because there is a non-linear relationship between electric load and the weather. The model results were fantastic, and were used to make decisions on how to meet capacity on days projected to need a high load.This is the first time that I learned that once you complete a project that people care about, you’ll most likely write a deck explaining the problem and outcomes.. and then you go “on tour”. Meaning, I created PowerPoint slides and presented my work to other teams. My first PowerPoint was not very good.
It has taken years of experience to get to a point where I now think that my decks are visually appealing, appropriately tailored for the audience I’m speaking to (have the right “level” of information), and engaging.
At NSTAR I also used a tiny bit of SAS. This was in the form of re-running code previously written by someone else. It sometimes also involved slightly modifying code that someone else had written, I definitely wouldn’t consider this job SAS intensive. More like “SAS button pushing”.
The models I was building everyday were built in “Point-and-Click” software.By far, NSTAR was my most “Statistic-y” job, but Time-Series is one small part in the world of Statistics. I wanted to expand my horizons, and learned that there was A TON of opportunity in Analytics…Quick Overview of The Rest Of My Positions: Analytics Consultant, Silverlink Communications
Delivered market research, segmentations, research posters, and communication campaigns designed to support managed care organizations (MCOs), pharmacy benefit managers (PBMs), and disease management (DM) clients.
Analytics Manager, Vistaprint
Vistaprint sells business cards and other marketing products online. Their main customer base is small businesses.
Managed a team of analysts to optimize the Vistaprint website.
Held a bunch of other roles and work on a ton of different projects across Analytics
Senior Data Scientist, Constant Contact
Contant Contact offers email marketing solutions. Also Ecommerce, also targets small businesses.
I’ve been at Constant Contact now for 2 months. My first goals are:
Checking the validity of a model that is already in place.
Improving upon how they currently do testing. And then automating!
Trying to identify seasonal customers in their customer base.
Learning lots of new things!
A Note on Titles: Titles are tricky. A title may sound snazzy and not pay as much, and sometimes a lower title could pay more than you expect!As leveraging data for business purposes is becoming increasingly popular, there is even more confusion around what roles and responsibilities and skills would typically fall under a certain title. Explore all of your options!You can check out average salaries for titles on a number of different sites.
The Tools I Use (Starting From Most Basic):Everywhere I have been has used Excel. The ability to do:
Pivot tables
V-lookups
Write a simple macro using the “record” button to automate some data manipulations
These types of things can make you look like a WIZARD to some other areas of the business. (Not saying it’s right, just saying that’s how it is)
And I’ve used these things THROUGHOUT my career.
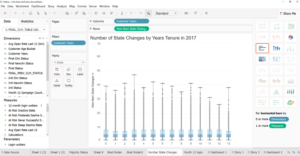
As data is getting bigger, companies are starting to move towards Tableau. I’m still new to it myself, but it has saved me from watching an Excel document take forever to save. I consider the days of waiting on large Excel files to mostly be just a thing of my past.
Data quickly becomes too large for Excel, I’ve found that anything higher than like 400k rows (with multiple columns) becomes a real chore to try and manipulate.
Pretty visualizations, can be interactive, quick, point-and-click.
Data Science Tableau chart image
Tableau can also take data in directly from SQL (a .csv, and a bunch of other formats as well).
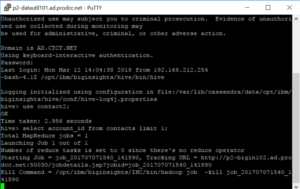
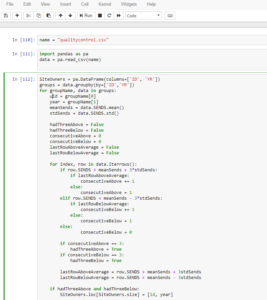
Data Science example of a simple query
Data Science use the command line to access Hive
Data Science example of my Python code in JupyterLab
The real workhorse of a job in Data Science in SQL. It's becoming more common to pull directly to R or Python from SQL and do your data manipulation there, but this still requires connecting to the database.In school, most of the data was given to me in a nice form, all I had to bring to the table was analysis and modeling. In industry, you have millions of rows in 100’s or 1,000’s of different tables.
This data needs to be gathered from relevant tables using relevant criteria. Most of the time you’ll be manipulating the data in SQL to get it into that nice/useable form that you’re so familiar with. And this is time intensive, you’ll start to realize that a significant portion of your job is deciding what data you need, finding the data, transforming the data to be reasonable for modelling, before you ever write a line of code in R or Python.My last 3 jobs in industry have involved SQL, and I’ve only had 4 jobs.You can pull data directly from SQL into Excel or R or Python or Tableau, the list continues.
There are many different “flavors” of SQL. If you know one, you can learn any other one. In the past, I had been intimidated by job postings that would list APS or some other variant. There may be slight differences in syntax, but they’re really just asking you to know SQL. Don’t be intimidated!Below is an example of a simple query. I’m selecting some id’s, month, year, and the count of a variable “sends” based on criteria given in the “where” statement. The query also shows a couple table joins, denoted by “join”, and then I give the criteria that the join is on.Once you understand SQL, making the jump to BigData is not as daunting. Using Hive (also something that looked intimidating on a job description), is much like SQL (plus some nested data you might need to work with), you can query data from Hadoop.I use the command line to access Hive, but nice UIs are out there.
If you look closely, you’ll see my query here is just “select account_id from contacts limit 1;” all that says is “give me one account_id from the contacts table”, and it looks just like SQL.
When I was getting my Masters in Statistics, everyone was using R. Even some statisticians now are making the move to Python. Previously, all of my modeling has been in R, but I’m testing the Python waters myself!
I taught myself Python in Coursera, and I’m currently using it in my new job. That’s the beauty of the internet. Want to learn a new tool? Just go learn it, the information is at your fingertips.Below is an example of my Python code in JupyterLab. It brand-spanking new, and really my screenshot does not do it justice. You can read more about JupyterLab here: JupyterLab
A quick note. I put my Coursera classes I’ve taken under “accomplishments” in LinkedIn. It’s not a bad idea.
Things I Didn’t Know About Industry:
You might have some Opportunity for travel — Fun-ness of destination can vary
I’ve been to Vegas, Orlando, Barcelona, Windsor Ontario, NJ and MD for Work.
There is typically budget for personal development
A book you want to read that is relevant? You can probably expense it.
A course on Coursera that is relevant? You can probably expense it.
They’ll send you to conferences sometimes
Was at the Jupyter Pop-up March 21st and I’m attending the Open Data Science Conference in May.
Don’t be shy about asking your boss if there is budget available.
To most it looks like you care about and are invested in your career!
Layoffs are a thing. I recently just learned about this first hand. And my experience was great.Vistaprint decided to downsize by $20m in employee salaries (182 people).
I got a pretty sweet severance package.
Tip! You can collect unemployment and severance at the same time!
This was the first opportunity I had in years to really think about the culture, direction, and really think about my next move.Vistaprint paid for a Career Coach that helped me with:
resume (they updated both my content and formatting).
Cover letter tips (description below)
Networking
Interviewing
Negotiating!
I literally took the requirements from the job and pasted them on the left. Then took my qualifications from my resume and posted them on the right. Took less than 15 minutes for each cover letter.
Interviewing
To read my more in-depth article about the in person interview in data science, click here
To read my more in-depth article about the job hunt in data science from the first application to accepting a job offer, click
Prepare talking about one of your projects in a way that the person interviewing you (who may have little context) is able to understand. High Level, focus on outcomes. Seriously, before you start talking about the project, describe what the objective was, it’s really easy to dive into something and not realize the other person has no idea what you’re talking about.I could really keep talking forever about the topics listed above, but wanted to give a brief overview hitting a bunch of different pieces of my experience. Maybe I’ll need to elaborate more later.Thank you for reading my experience. I hope you have great success navigating your way into the field of Data Science. When you get there, I hope you find it fulfilling. I do.
What the successful data science job hunt might look like. Data analysis, data collection , data management, data tracking, data scientist, data science, big data, data design, data analytics, behavior data collection, behavior data, data recovery, data analyst. For more on data science, visit www.datamovesme.com.


