Effective Data Science Presentations

If you're new to the field of Data Science, I wanted to offer some tips on how to transition from presentations you gave in academia to creating effective presentations for industry.Unfortunately, if your background is of the math, stats, or computer science variety, no one probably prepared you for creating an awesome data science presentations in industry.  And the truth is, it takes practice.  In academia, we share tables of t-stats and p-values and talk heavily about mathematical formulas.  That is basically the opposite of what you'd want to do when presenting to a non-technical audience.If your audience is full of a bunch of STEM PhD's then have at it, but in many instances we need to adjust the way we think about presenting our technical material.I could go on and on forever about this topic, but here we'll cover:

  1. Talking about model output without talking about the model

  2. Painting the picture using actual customers or inputs

  3. Putting in the Time to Tell the Story

Talking about model output without talking about the modelCertain models really lend themselves well to this.  Logistic regression, decision trees, they're just screaming to be brought to life.You don't want to be copy/pasting model output into your data science presentations.  You also don't want to be formatting the output into a nice table and pasting it into your presentation.  You want to tell the story and log odds certainly are not going to tell the story for your stakeholders.A good first step for a logistic regression model would just be to exponentiate the log odds so that you're at least dealing in terms of odds.  Since this output is multiplicative, you can say:"For each unit increase of [variable] we expect to see a lift of x% on average with everything else held constant."So instead of talking about technical aspects of the model, we're just talking about how the different drivers effect the output. 

We could, however, take this one step further. 

Using Actual Customers to Paint the Picture: I love using real-life use cases to demonstrate how the model is working.  Above we see something similar to what I presented when talking about my seasonality model.  Of course I changed his name for this post, but in the presentation I would talk about this person's business, why it's seasonal, show the obvious seasonal pattern, and let them know that the model classified this person as seasonal.  I'm not talking about fourier transforms, I'm describing how real people are being categorized and how we might want to think about marketing to them.  Digging in deep like this also helps me to better understand the big picture of what is going on.  We all know that when we dig deeper we see some crazy behavioral patterns.Pulling specific customers/use cases works for other types of models as well.  You built a retention model?  Choose a couple people with a high probability of churning, and a couple with a low probability of churning and talk about those people."Mary here has been a customer for a long time, but she has been less engaged recently and hasn't done x, y, or z (model drivers), so the probability of her cancelling her subscription is high, even though customers with longer tenure are usually less likely to leave. 

Putting in the Time to Tell the Story: As stated before, it takes some extra work to put these things together.  Another great example is in cluster analysis.  You could create a slide for each attribute, but then people would need to comb through multiple slides to figure out WHO cluster 1 really is vs. cluster 2, etc.  You want to aggregate all of this information for your consumer.  And I'm not above coming up with cheesy names for my segments, it just comes with the territory :).It's worth noting here that if I didn't aggregate all this information by cluster, I also wouldn't be able to speak at a high level about who was actually getting into these different clusters.  That would be a large miss on my behalf, because at the end of the day, your stakeholders want to understand the big picture of these clusters.Every analysis I present I spend time thinking about what the appropriate flow should be for the story the data can tell. 

I might need additional information like market penetration by geography, (or anything, the possibilities are endless).  The number of small businesses by geography may not have been something I had in my model, but with a little google search I can find it.  Put in the little extra work to do the calculation for market penetration, and then create a map and use this information to further support my story.  Or maybe I learn that market penetration doesn't support my story and I need to do more analysis to get to the real heart of what is going on.  We're detectives. And we're not just dealing with the data that is actually in the model.  We're trying to explore anything that might give interesting insight and help to tell the story.  Also, if you're doing the extra work and find your story is invalidated, you just saved yourself some heartache.  It's way worse when you present first, and then later realize your conclusions were off.  womp womp. 

Closing comments: Before you start building a model, you were making sure that the output would be actionable, right?  At the end of your presentation you certainly want to speak to next steps on how your model can be used and add value whether that's coming up with ideas on how you can communicate with customers in a new way that you think they'll respond to, reduce retention, increase acquisition, etc.  But spell it out.  Spend the time to come up with specific examples of how someone could use this output.I'd also like to mention that learning best practices for creating great visualizations will help you immensely. 

There are two articles by Kate Strachnyi that cover pieces of this topic.  You can find those articles here and here. If you create a slide and have trouble finding what the "so what?" is of the slide, it probably belongs in the appendix.  When you're creating the first couple decks of your career it might crush you to not include a slide that you spent a lot of time on, but if it doesn't add something interesting, unfortunately that slide belongs in the appendix.I hope you found at least one tip in this article that you'll be able to apply to your next data science presentation.  If I can help just one person create a kick-ass presentation, it'll be worth it.   

Read More
Career Career

Strong Data Science Content for Your Resume

The biggest pain point or challenge I hear when people are writing their resume is that they want concise, crisp, effective content that sounds impactful. But they’re not sure how to write that wonderful content they want.

There is so much to consider when thinking about your content. There are many different traits you want to showcase on your resume that the business values for any given position. There is much more to a successful data science hire than just technical and machine learning ability, and we'll want to think about how to best position these skills as well. Here are some quick examples of how you can up-level the content on your resume to get you started.

Here we’re going to cover:

  • Starting with a verb
  • Ending with the value you provided

Starting with a verb

Strong statements start with an action verb. A short list of some verbs that you can try to apply to your experience include:

  • Built
  • Delivered
  • Developed
  • Increased efficiency
  • Created
  • Evaluated
  • Trained

Try to vary your verbs as well. Don’t use the same one over and over again throughout your resume.

So we have some words, let’s look at some real examples from resumes and how the statements improve by starting with a verb.

This first example comes from a math teacher who is learning data science through MOOCs and is planning to make a career change.

Original: “I ran live lessons on Blackboard Collaborate and attended meetings via the computer.”

Updated: "Presented math training virtually, delivered mathematical concepts in a way that students could easily comprehend and learn."

This shows that she is able to break down material and communicate well. The following would also work:

Updated (another version): "Conducted virtual meetings with expert communication. Provided students the ability to receive one-on-one guidance to keep them on pace in a way that fit their schedule."

The next example is from a BI professional who is also looking to make a move to data science:

Original: “Participation in Global Transformation Program as Commercial Finance Business Intelligence (BI) expert (Credit and Collections), in the definition of KPIs and Global template Reports. Testing, Business Readiness and Post Go live support for Ecuador implementation (Releases 1, 2 and 3). Support to front office area (sales and distribution).”

Here, our example owned the definition of KPIs and reporting. She also contributed cross-functionally to help make this project a success. Talking about ownership of KPIs, and being a strong contributor cross-functionally sounds stronger when we begin with a verb instead of “participation” (noun).

Updated:  "Owned definition of KPIs and reporting, ensuring accuracy and allowing for self-service of key metrics by stakeholders."I'd certainly need to create more bullet points to capture all of the information in the original, but this is an idea of what we're trying to achieve.

Ending your statements with the result or value

Let’s look at an opportunity for improvement that was on my resume for a while.

Original: “Built Neural Network models to forecast hourly electric load.”

Cool story, but did I just build it for fun? Or was it useful? Especially in a space where businesses are all too familiar with someone building a fancy model, and then it never gets used for anything, it is of utmost importance that you clearly demonstrate how your work was utilized.

Spell. it. out.

Updated: “Built Neural Network models to forecast hourly electric load. Model output was imperative during extreme weather and was used for capacity planning decisions.”

Now I have a statement that shows not only that I delivered a model, but that model delivered value to the business.

Maybe your previous work experience doesn’t involve building a model. Maybe you built a dashboard. Did that dashboard allow your stakeholders to get valuable information on their own (referred to as self-service)? That’s value. Did the dashboard reduce the amount of time spent on ad-hoc, low value data aggregation so you could focus on higher value initiatives? That’s value, because here you’re increasing efficiency.

Using verbs as your starting point and demonstrating the value your work provided is a great step towards marketing yourself and showcasing your talents. Think deeply about what was the purpose of the work, and spell that out on your resume.

Read More
Career Career

Trying to Change Careers or Get Your Start in Data Science?

If you’re someone who is looking to make a move to data science, there are some ways that you can polish your approach to get noticed during your job search.

Assuming that you've built up the skills required for the job see if you're able to leverage some of these tips:

  • Optimize your resume (as best you can) for the job you WANT not the jobs you’ve HAD.

  • Try to gain experience at your current job (if you’re a career changer), or work on your own data science projects at home. (continuous learning is a big plus).

  • Develop a killer elevator pitch.

Optimizing your resume for the job you want:

Describe your projects in a way that shows you’re results-focused.

The points you’re going to want to demonstrate on your resume need to both:

  • Demonstrate that you understand general corporate culture, and showcase your collaborative, result achieving, problem solving and self-managing competencies.

  • Show that you have the technical chops as a data scientist.

The first bullet takes a lot of thought - it is really easy to list job duties, it’s another thing to reword them effectively to highlight your true strengths and demonstrate how what you've done has improved the business. Your bullet points should be full of action verbs and results, even if you need to stretch yourself mentally to identify these.

  • Did you automate a process that saved hours of time manually doing a task?  That time saved is business value.

  • Demonstrating that you've worked cross-functionally or presented results to the business are again, things that are desirable for the new job you want (data scientist).

It is helpful to read job descriptions and see what companies are looking for, you'll find consistent themes.  If you look closely, you'll see there are a lot of skills listed that aren't necessarily technical.  Make sure you shine when speaking to those softer skills.  But of course, these softer skills need to be demonstrated in a way that still demonstrates an action and result.  Do not just put a "soft skills" section on your resume and list a bunch of words with no context.

"Show you have the technical chops as a data scientist".  This is pretty straight-forward. Try to use the verbiage from the actual job description for the job you're applying to. You might want to sound fancy, but “empirical bayesian 3-stage hierarchical model” probably isn’t on the job description. Having this specifically listed on your resume isn’t going to help you pass ATS (the applicant tracking system), and the person in human resources who doesn’t have a data science background is not going to know whether that is relevant or not.  Again, looking at multiple job descriptions and trying to gauge what type of language to use on your resume is helpful.

Gain experience at your current job or work on a project:

If you currently have a job, do you have access to SQL? Does your company have a data warehouse or database? Can you file a ticket with the service desk to get SQL? Can you then play with data to make your own project?

You could even go a step further and bring data from the database into R or Python. Maybe you make a nice decision tree that answers a business questions then wonderfully and concisely place your results of your project on your resume.

Try to automate a task that’s repeatable that you do on a regular cadence. That’s next level resume content. You’re increasing efficiency in this scenario.

If you’ve done data science projects on your own to round out your resume, make sure those bullets are full of action verbs and results, action verbs and results. I almost want to say it a third time.

SQL Lite is open source, R is open source, Python is open source, there is tons of free data out there. The world can really be your oyster, but you’ll need to market these go-getter skills effectively.

Develop a killer elevator pitch:

A strong, well-targeted resume might open the door, but you need to keep that door open and keep the conversation going once the door has been opened. The resume does nothing more than open the door, that’s it.

Getting your resume into the right hands can sometimes be difficult. Leveraging LinkedIn effectively can help bridge that gap. How do we begin the conversation if you’re reaching out to someone on LinkedIn to ask about opportunities?

Important note: When cold reaching out to people on LinkedIn, this should be after you have visited the company website, found a job that you’re interested in and (pretty much) qualified for, and then you reach out to a relevant person with a well-targeted message.

It is impossible to be well-targeted if you are reaching out to someone who works at a company that doesn’t have any positions available. Because you didn’t read a job description. So you wouldn’t be able to infer the needs of the business. Data Science is a large field, with many specializations, a blanket approach will not work.

Back to the pitch. You’re results-focused, you’re innovative, and you view things from the business’ perspective.

  • I'd suggest starting with something conversational, this will help if the person you're messaging is already being inundated with requests.  A comment about a post they made recently makes your connection come across as more authentic.

  • Why you’re messaging: you’re interested in the open position, and you’re trying to get your resume to the correct person.

  • Then mention a number of things concisely that are specifically mentioned on the job description. Basically saying “hi, look at me, I’m a fit.”

  • Let them know that you’d really appreciate it if they’d simply forward you to the correct person (hopefully the person you’re messaging is the correct person, but there is also a chance it’s not the right person, so don’t assume).

  • Close strong. You’re here to add value for the company, not to talk about your needs; imply you’re aware that you’re here to talk about how you can fit the needs of the business.

Hi [name],

I enjoyed your recent post on [topic] and I look forward to reading more of your posts.

I noticed [company] is hiring for [position title], and I’m hoping I can get my resume in the right hands. I have an MS in Statistics, plus 7 years of real-world experience building models. I’m a wiz at SQL, modeling in R, and I have exposure to Python.

I’d appreciate the opportunity to speak with the appropriate person about the open position, and share how I’ve delivered insights and added value for companies through the use of statistical methods.

Thanks, Kristen

Now you may have a very different background from me. However, you can talk about the education that you do have (concisely), the exposure that you do have to building models, about your technical chops, and that you want to deliver value.

I hope that you’ll be able to use some of these suggestions. And I wish you a successful a rewarding career in data science. If you have additional suggestions for trying to make a change to data science, I’d love to hear your thoughts!  The next article I post will be covering how to write crisp content for your resume that makes an impact, that article is here.

Read More
Career Career

Up-Level Your Data Science Resume - Getting Past ATS

This series is going to dive into the tip of the iceberg on how to create an effective resume that gets calls. When I surveyed my email list, the top three things that people were concerned about regarding their resumes were:

  • Being able to get past ATS (Applicant Tracking System)
  • Writing strong impactful bullet points instead of listing “job duties”
  • How to position yourself when you haven’t had a Data Science job previously

This article is the first part of a three-part series that will cover the above mentioned topics. Today we’re going to cover getting past ATS.

If you’re not familiar with ATS, it stands for Applicant Tracking System. If you’re applying directly on a website for a position, and the company is medium to large, it’s very likely that your resume will be subject to ATS before:

1. Your resume lands in the inbox of HR

2. You receive an automated email that looks like this:

resume denial letter

It’s hard to speak for all ATS systems, because there are many of them. Just check out the number of ATS systems that indeed.com integrates with https://www.indeed.com/hire/ats-integration.

So how do you make sure you have a good chance of getting past ATS?

1. Make it highly likely that your resume is readable by ATS

2. Make it keyword rich, since ATS is looking for keywords specific to the job

Being readable by ATS:

There has been a movement lately to create these gorgeously designed resumes. You’ll see people “Tableau-ize” their resume (ie — creating a resume using Tableau), include logos, or include charts that are subjective graphs of their level of knowledge in certain skill sets. An example of one of these charts looks like this:

resume skills

ATS is not going to know what to do with those dots, just as it wouldn’t know what to do with a logo, your picture, or a table; do not use them. To test if your resume is going to be parsed well by ATS, try copying the document and pasting it in word. Is it readable? Or is there a bunch of other stuff? You can also try saving it as plain text and see what it looks like.

As data-loving story tellers, I understand the desire to want to show that you’re able to use visualizations to create an aesthetically appealing resume. And if you’re applying through your network, and not on a company website, maybe you’d consider these styles. I’m not going to assume I know your network and what they’re looking for. And of course, you can have multiple copies of your resume that you choose to use for specific situations.

What is parsable:

I’ve seen a number of blog posts in the data world saying things to the tune of “no one wants to see one of those boring old resumes.” However, those boring resumes are likely to score higher in ATS, because the information is parsable. And you can create an aesthetically pleasing, classic resume.

Some older ATS systems will only parse .doc or .docx formats, others will be able to parse .pdf, but not all elements of the .pdf will be readable if you try to use the fancy image types mentioned above.

Making your resume rich with keywords:

This comes in 2 forms:

1. Making sure that the skills mentioned in these job descriptions are specifically called out on your resume using the wording from the JD.

2. Reducing the amount of “fluff” content on your resume. If your bullets are concise, the ratio of keywords to fluff will be higher and will help you score better.

For point 1, I specifically mention my skills at the top of my resume:

resume programs and experience

I also make a point to specifically mention these programs and skills where applicable in the bullet points in my resume. If a job description calls for logistic regression, I would add logistic regression specifically to my resume. If the JD calls for just “regression,” I’ll leave this listed as regression on my resume. You get the idea.

It's also important to note that more than just technical skills matter when reading a job description. Companies are looking for employees who can also:

  • communicate with the business
  • work cross-functionally
  • explain results at the appropriate level for the audience that is receiving the information.

If you’re applying for a management position, you’re going to be scored on keywords that are relevant to qualities that are expected of a manager. The job description is the right place to start to see what types of qualities they’re looking for. I’ll have highlighted specific examples in my resume course I’m launching soon.

For point 2, you want to make your bullet points as concise as possible. Typically starting with a verb, mentioning the action, and the result. This will help you get that ratio of “keywords:everything” as high as possible.

In my next article in this series I'm sharing tips on how to position yourself for a job change.  That article is here.

Read More

Favorite MOOCs for Data Scientists

favorite MOOCs

I had asked on LinkedIn recently about everyone’s favorite MOOCs in data science. This post started a lot of great discussion around the courses (and course platforms) that people had experience with. Certain courses were mentioned multiple times and were obviously being recommended by the community.Here was the post:Biggest takeaway:

Anything by Kirill Eremenko or Andrew NG were highly regarded and mentioned frequently.

favorite mentions graph for data science

So I decided to revisit this post, and aggregate the information that was being shared so that people who are looking for great courses to build their data science toolkit can use this post as a starting point.You’ll notice that below Coursera had the most mentions, this is mostly driven by Andrew Ng’s Machine learning course (11 mentions for that course alone) and Python For Everybody (6 mentions, also on Coursera). Similarly, Kirill has a number of courses on Udemy that all had multiple mentions, giving Udemy a high number of mentions in the comments as well. (Links to courses are lower in this article).The 2 blanks were due to one specific course. “Statistical Learning in R” it is a Stanford course. Unfortunately I wasn’t able to find it online. Maybe someone can help out by posting where to find the course in the comments?

Update! Tridib Dutta and Sviatoslav Zimine reached out within minutes of this article going live to share the link for the Stanford Course. There was also an Edx course that was recommended that is not currently available, “Learning From Data (Introductory Machine Learning)" so I won’t be linking to that one.

If you’re familiar with MOOCs, a number of platforms allow you to audit the course (i.e. watch the videos and read the materials for free) so definitely check into that option if you’re not worried about getting graded on your quizzes.To make the list, a course had to be recommended by at least 2 people (with the exception of courses covering SQL and foundational math for machine learning, since those didn’t have a lot of mentions, but the topics are pretty critical :).I've organized links to the courses that were mentioned by topic. Descriptions of courses are included when they were conveniently located on the website.

Disclaimer: Some of these links are affiliate links, meaning that at no cost to you, I’ll receive a commission if you buy the course.

SQL:

  1. “Sabermetrics 101: Introduction to Baseball Analytics — Edx”“An introduction to sabermetrics, baseball analytics, data science, the R Language, and SQL.”

  2. “Data Foundations” — Udacity“Start building your data skills today by learning to manipulate, analyze, and visualize data with Excel, SQL, and Tableau.”

Math:

“Mathematics for Machine Learning Specialization” — Coursera“Mathematics for Machine Learning. Learn about the prerequisite mathematics for applications in data science and machine learning.”

Tableau:

“Tableau 10 A-Z: Hands-On Tableau Training for Data Science!” — Udemy (This is a Kirill Eremenko course)

R:

  1. “R Programming” — Coursera “The course covers practical issues in statistical computing which includes programming in R, reading data into R, accessing R packages, writing R functions, debugging, profiling R code, and organizing and commenting R code.”

  2. "R Programming A-Z™: R For Data Science With Real Exercises!" — Udemy (This is a Kirill Eremenko course)"Learn Programming In R And R Studio. Data Analytics, Data Science, Statistical Analysis, Packages, Functions, GGPlot2"

If you're looking for the best R course that has ever existed, read about my favorite R programming course.  I wouldn't call it a MOOC, because you have direct access to the instructor through Slack.  But if you're serious about learning R, check this out.  Link

Python:

  1. “Python for Everybody Specialization” — Coursera“will introduce fundamental programming concepts including data structures, networked application program interfaces, and databases, using the Python programming language.”

  2. “Learn Python” — CodeAcademy

Python for Data Science:

  1. “Applied Data Science With Python Specialization” — Coursera

  2. “Python for Data Science” — Edx “Learn to use powerful, open-source, Python tools, including Pandas, Git and Matplotlib, to manipulate, analyze, and visualize complex datasets.”

Machine Learning:

  1. “Machine Learning” — Coursera (This is an Andrew Ng course)

  2. “Machine Learning A-Z™: Hands-On Python & R In Data Science” — Udemy (This is a Kirill Eremenko course)

  3. “Python for Data Science and Machine Learning Bootcamp”— Udemy “Learn how to use NumPy, Pandas, Seaborn , Matplotlib , Plotly , Scikit-Learn , Machine Learning, Tensorflow , and more!”

Deep Learning:

“Deep Learning Specialization” — Coursera (This is an Andrew Ng course)" In five courses, you will learn the foundations of Deep Learning, understand how to build neural networks, and learn how to lead successful machine learning projects. You will learn about Convolutional networks, RNNs, LSTM, Adam, Dropout, BatchNorm, Xavier/He initialization, and more.”No one had anything bad to say about any particular course, however, some people did have preferences in terms of platforms. You can read the original post yourself here.I hope these courses help you widdle down the plethora of options (it’s overwhelming!) and I hope you learn some great new information that you can apply in your career. Happy learning!

Favorite MOOCs for Data Scientists. Data science courses. Data Science resources. Data analysis, data collection, data management, data tracking, data scientist, data science, big data, data design, data analytics, behavior data collection, behavior data, data recovery, data analyst. For more on data science, visit www.datamovesme.com

Read More

How Blogging Helps You Build a Community in Data Science

Holy Moly. I started blogging in March and it has opened my eyes.I want to start off by saying that I didn't magically come up with this idea of blogging on my own. I noticed my friend Jonathan Nolis becoming active on LinkedIn, so I texted them to get the scoop. They told me to start a blog and jokingly said "I'm working on my #brand". I'm the type of person to try anything once, plus I already owned a domain name, had a website builder (from working at Vistaprint), and I have an email marketing account (because I work for Constant Contact). So sure, why not? If you're thinking about starting a blog. Know that you do not need to have a bunch of tools already at your disposal. If needed, you can create articles on LinkedIn or Medium. There are many options to try before investing a penny . . . but of course, you can go ahead and create your own site.

I have since moved to self-hosted Wordpress. I've fallen in love with blogging, and Wordpress lets me take advantage of lots of extra functionality.With my first post, my eyes started to open up to all the things that other members of the Data Science community were doing. And honestly, if you had asked me about who I most looked up to in Data Science prior to starting my blog, I'd probably just rattle off people who have created R packages that have made my life easier, or people who post a lot of answers to questions on Stack Overflow. But now I was paying attention on LinkedIn and Twitter, and seeing the information that big data science influencers like Kirk Borne, Carla Gentry, Bernard Marr, and many others (seriously, so many others) were adding to the community.

I also started to see first hand the amount of people that were studying to become a data scientist (yay!). Even people who are still in school or very early in their careers are participating by being active in the data science community. (You don't need to be a pro, just hop in).  If you're looking for great courses to take in data science, these ones have been highly recommended by the community here.I've paid attention to my blog stats (of course, I'm a data nerd), and have found that the articles that I write that get the biggest response are either:

  1. Articles on how to get into data science

  2. Coding demos on how to perform areas of data science

But you may find that something different works for you and your style of writing. I don't just post my articles on LinkedIn. I also post on Twitter, Medium, I send them to my email list, and I put them on Pinterest. I balked when someone first mentioned the idea of Pinterest for data science articles. It's crazy, but Pinterest is the largest referrer of traffic to my site. Google Analytics isn't lying to me.

I've chatted with so many people in LinkedIn messaging, I've had the opportunity to speak with and (virtually) meet some awesome people who are loving data and creating content around data science. I'm honestly building relationships and contributing to a community, it feels great. If you're new to the "getting active in the data science community on LinkedIn" follow Tarry Singh, Randy Lao, Kate Strachnyi, Favio Vazquez, Beau Walker, Eric Weber, and Sarah Nooravi just to name a few. You'll quickly find your tribe if you put yourself out there. I find that when I participate, I get back so much more than I've put in.Hitting "post" for the very first time on content you've created is intimidating, I'm not saying that this will be the easiest thing you ever do. But you will build relationships and even friendships of real value with people who have the same passion. If you start a blog, I look forward to reading your articles and watching your journey.

Building community in data science through blogging. Data analysis, data collection , data management, data tracking, data scientist, data science, big data, data design, data analytics, behavior data collection, behavior data, data recovery, data analyst. For more on data science, visit www.datamovesme.com

Read More

Beginning the Data Science Pipeline - Meetings

I spoke in a Webinar recently about how to get into Data Science. One of the questions asked was "What does a typical day look like?"  I think there is a big opportunity to explain what really happens before any machine learning takes place for a large project. I've previously written about thinking creatively for feature engineering,  but there is even more to getting ready for a data science project, you need to get buy in on the project from other areas of the business to ensure you're delivery insights that the business wants and needs.It may be that the business has a high priority problem for you to solve, but often you'll identify projects with a high ROI and want to show others the value you could provide if you were given the opportunity to work on the project you've come up with.The road to getting to the machine learning algorithm looks something like:

  • Plenty of meetings

  • Data gathering (often from multiple sources)

  • Exploratory data analysis

  • Feature engineering

  • Researching the best methodology (if it's not standard)

  • Machine learning

We're literally going to cover the 1st bullet here in this article. There are a ton of meetings that take place before I ever write a line of SQL for a big project.  If you read enough comments/blogs about Data Science, you'll see people say it's 90% data aggregation and 10% modeling (or some other similar split), but that's also not quite the whole picture. I'd love for you to fully understand what you're signing up for when you become a data scientist. 

Meetings: As I mentioned, the first step is really getting buy in on your project.  It's important that as an Analytics department, we're working to solve the needs of the business.  We want to help the rest of the business understand the value that a project could deliver, through pitching the idea in meetings with these stakeholders.  Just to be clear, I'm also not a one woman show. My boss takes the opportunity to talk about what we could potentially learn and action on with this project whenever he gets the chance (in additional meetings). After meetings at all different levels with all sorts of stakeholders, we might now have agreement that this project should move forward.

More Meetings: At this point I'm not just diving right into SQL.  There may be members of my team who have ideas for data that I'm not aware of that might be relevant.  Other areas of the business can also help give inputs into what variables might be relevant (they don't know they database, but they have the business context, and this project is supposed to SUPPORT their work).There is potentially a ton of data living somewhere that has yet to be analyzed, the databases of a typical organization are quite large, unless you've been at a company for years, there is most likely useful data that you are not aware of.

The first step was meeting with my team to discuss every piece of data that we could think of that might be relevant.  Thinking of things like:

  • If something might be a proxy for customers who are more "tech savvy".  Maybe this is having a business email address as opposed to a gmail address (or any non-business email address), or maybe customers who utilize more advanced features of our product are the ones we'd consider tech savvy.  It all depends on context and could be answered in multiple ways.  It's an art.

  • Census data could tell us if a customers zip code is in a rural or urban area? Urban or rural customers might have different needs and behave differently, maybe the extra work to aggregate by rural/urban isn't necessary for this particular project.  Bouncing ideas off other and including your teammates and stakeholders will directly impact your effectiveness.

  • What is available in the BigData environment? In the Data Warehouse? Other data sources within the company.  When you really look to list everything, you find that this can be a large undertaking and you'll want the feedback from others.

After we have a list of potential data to find, then the meetings start to help track all that data down.  You certainly don't want to reinvent the wheel here.  No one gets brownie points for writing all of the SQL themselves when it would have taken you half the time if you leveraged previously written queries from teammates. If I know of a project where someone had already created a few cool features, I email them and ask for their code, we're a team.  For a previous project I worked on, there were 6 different people outside of my team that I needed to connect with who knew these tables or data sources better than members of my team.  So it's time to ask those other people about those tables, and that means scheduling more meetings.

Summary: I honestly enjoy this process, it's an opportunity to learn about the data we have, work with others, and think of cool opportunities for feature engineering.  The mental picture is often painted of data scientists sitting in a corner by themselves, for months, and then coming back with a model.  But by getting buy in, collaborating with other teams, and your team members, you can keep stakeholders informed through the process and feel confident that you'll deliver what they're hoping.  You can be a thought partner that is proactively delivering solutions.

Tips for starting a data science project. Data analysis, data collection , data management, data tracking, data scientist, data science, big data, data design, data analytics, behavior data collection, behavior data, data recovery, data analyst. For more on data science, visit www.datamovesme.com.

Read More
Segmentation Segmentation

A Different Use of Time Series to Identify Seasonal Customers

I had previously written about creatively leveraging your data using segmentation to learn about a customer base. The article is here. In the article I mentioned utilizing any data that might be relevant. Trying to identify customers with seasonal usage patterns was one of the variables that I mentioned that sounded interesting. And since I'm getting ready to do another cluster analysis, I decided to tackle this question.

These are my favorite types of data science problems because they require you to think a little outside the box to design a solution.  Basically, I wanted to be able to tag each customer as whether or not they exhibited a seasonal pattern, this would be a first step.  Later I may further build this out to determine the beginning of each customer's "off-season."  This will allow us to nurture these customer relationships better, and provide a more personalized experience.

I'm a data scientist at Constant Contact, which provide email marketing solutions to small businesses.  Since it is a subscription product, customers have different usage patterns that I'm able to use for this analysis.

At first, my assumption was that a good portion of these customers might be living in an area that has four seasons.  You know, the ice cream shop in New England that shuts down for the winter.  After thinking about it some more, if I'm looking for seasonal usage patterns, this is also going to include people with seasonal business patterns that aren't necessarily driven by the weather.  People who have accounts in the education field taking summers off are going to be picked up as seasonal.  Businesses in retail who have pretty consistent usage all year, but pick up their engagement at Christmas are also exhibiting a seasonal pattern.  So the people who the model would determine were seasonal were not based solely on the weather, but could also be by the type of business.  (Or maybe there are people that are fortunate enough to take random long vacations for no reason in the middle of the year, I want to make sure I find those people too, if they exist).

To do this analysis, I aggregated the email sending patterns of each customer with at least 2 years by customer, by month.  Each customer is it's own time series. However, there were a couple complexities.  One detail in particular is worth noting, customers might take a month or two (or more) off from usage.  So first I had to write some code to fill in zeros for those months.  I couldn't be specifying that I was looking for a yearly pattern, but only giving 8 months worth of data per year in the model, I needed those zeros.  I found these missing zeros using Python, and then decided I wanted to use R for the time series/determining if a seasonal pattern was present portion.  I got to use the rpy2 package in Python for the first time. Check that off the list of new packages I've wanted to try.

I fit a TBATS model for each customer in R.  This is probably overkill, because TBATS was meant to deal with very complex (and potentially multiple) seasonal patterns.  However, it was really simple to ask the model if it had a yearly seasonal component.  Bonus, TBATS is more robust to stationarity than other methods. 

Here is a picture of a customer who the model determined to be seasonal, and on the right is a customer who is obviously not seasonal, and the model agrees.

seasonal vs non-seasonal graphAfter I had the output of my model, I went back and did a full analysis of what these customers looked like. They over-indexed in the Northeast, and were less likely to be in the West and South. Seasonal users were also more likely to self-report being in an industry like:

  • Retail
  • Sports and Recreation
  • Non Profits

Non seasonal users were also more likely to self-report being in an industry like:

  • Auto Services
  • Financial Advisor
  • Medical Services
  • Insurance

Customers with only 2-3 years tenure were less likely to be seasonal than more tenured customers.  This could potentially be due to a couple different factors.  Maybe there just wasn't enough data to detect them yet, maybe they have some period of getting acquainted with the tool (involving a different usage pattern) before they really hit their stride, or maybe they're just really not seasonal. There were more insights, but this is company data ;)Here is a map of seasonal customers over-indexing in the Northeast.  Stakeholders typically enjoy seeing a nice map.  Note:  The split was not 50/50 seasonal vs. non-seasonal.seasonal percentage mapAt the moment, we're thinking through what data we might be able to leverage in the upcoming segmentation (where this seasonal variable will be one candidate variable.  This might include information from the BigData environment or anything that lives in the relational database. We're also weighing difficulty to get a specific variable compared to the added value we might get from gathering that data.  I feel super fortunate to be able to work on projects that help us learn about our customers, so that when we message to them, we can be more relevant. Nothing is worse than receiving a communication from a company that totally misses the mark on what you're about. I find this type of work exciting, and it allows me to be creative, which is important to me. I hope you found this article enjoyable, and maybe there is a couple people out there that will actually find this applicable to their own work.  I wish you lots of fun projects that leave you feeling inspired :)Again, the code I used to do this project can be found in my article here.

A different use of time series to identify seasonal customers. Data science courses. Data Science resources. Data analysis, data collection , data management, data tracking, data scientist, data science, big data, data design, data analytics, behavior data collection, behavior data, data recovery, data analyst. For more on data science, visit www.datamovesme.com
Read More

What I Enjoyed Most at ODSC East 2018

Last week I had the opportunity to attend Open Data Science Conference (ODSC) in Boston.  It was awesome to see people just walking around who I had previously read about or I'm following them on twitter.  It was even nicer to meet some of these people, and I was amazed at how friendly everyone was.

Of course you can't attend everything at a conference like this, at one point there was 11 different sessions going on at once.  It was really difficult to determine which sessions to attend given the number of great options, but I tried to align the information I'd be consuming closely with what I'd be able to bring back to my day job and implement.

In this article I'll cover some learnings/ favorite moments from:

  • one of the trainings
  • a couple different workshops
  • the sweet conference swag
  • mention one of the keynotes

Trainings:My original plan was to take an R training in the morning on Tuesday and take a Python training that afternoon.  However, what really happened was I went to the R training in the morning, this training left me feeling super jazzed about R, and so I ended up going to another R training that afternoon (instead of the Python training I had originally planned on).  The morning R training I took was "Getting to grips with the tidyverse (R)" given by Dr. Colin Gillespie.  This was perfect, because I had been struggling with dplyr (an R package) the night previously, and this training went through parts of dplyr with great explanations along the way.  Colin also showed us how to create plots using the package "Plotly".  This was my first time creating an interactive graph in R. Easy to use, and super cool. He was also nice enough to take a look at the code I was currently working on, I definitely appreciated this.

The afternoon R training I attended was given by Jared Lander entitled "Intermediate RMarkdown in Shiny".  It was my first introduction to Shiny.  I had heard about it, but had never ventured to use it, now I don't know what I was waiting for. If you ever have the opportunity to hear Jared speak, I found him incredibly entertaining, and he explained the material clearly, making it super accessible.  I like to think Jared also enjoyed my overly animated crowd participation.  
Workshops:

On Thursday I attended "Uplift Modeling and Uplift Prescriptive Analytics: Introduction and Advanced Topics" by Victor Lo, PHD. This information really resonated with me.  Dr. Lo spoke about the common scenario in Data Science where you'll build a model to try and predict something like customer attrition.  You'd maybe take the bottom three deciles (the people with the highest probability of cancelling their subscription, and do an A/B test with some treatment to try and encourage those customers to stay.  

In the end, during analysis, you'd find that you did not have a statistically significant lift in test over control with the usual methods.  You end up in a situation where the marketers would be saying "hey, this model doesn't work" and the data scientist would be saying "what? It's a highly predictive model".  It's just that this is not the way that you should be going about trying to determine the uplift.  Dr. Lo spoke about 3 different methods and showed their results.  

These included:

  • Two Model Approach
  • Treatment Dummy Approach
  • Four Quadrant Method

Here is the link to his ODSC slides from 2015 where he also covered these 3 models (with similar slides): here 

I've experienced this scenario before myself, where the marketing team will ask for a model and want to approach testing this way.  I'm super excited to use these methods to determine uplift in the near future.

Another workshop I attended was "R Packages as Collaboration Tools" by Stephanie Kirmer (slides).  Stephanie spoke about creating R packages as a way to automate repeated tasks.  She also showed us how incredibly easy it is to take your code and make it an R package for internal use.  Here is another case that is applicable currently at my work.  I don't have reports or anything that is due on a regular cadence, but we could certainly automate part of the test analysis process, and there are currently ongoing requests asked of Analytics in our organization that could be automated.  Test analysis is done in a different department, but if automated, this would save time on analysis, reduce potential for human error in test analysis, and free up bandwidth for more high value work.SWAG:

Although conference swag probably doesn't really need a place in this article, Figure Eight gave out a really cool little vacuum that said "CLEAN YOUR DATA".  I thought I'd share a picture with you.  Also, my daughter loved the DataRobot stickers and little wooden robots they gave out.  She fashioned the sticker around her wrist and wore it as a bracelet.  3 year olds love conference swag:

ODSC vacuum  ODSC stickers Keynote:The keynote was Thursday morning.  I LOVED the talk given by Cathy O'Neil, a link to her TED talk is here.  She spoke about the importance of ethics in data science, and how algorithms have to use historical data, therefore, they're going perpetuate our current social biases. I love a woman who is direct, cares about ethics, and has some hustle.  Go get em' girl. I made sure to get a chance to tell her how awesome her keynote was afterwards.  And of course I went home and bought her book "Weapons of Math Destruction".  I fully support awesome. Summary:I had an incredible time at the ODSC conference.  Everyone was so friendly, my questions were met with patience, and it was clear that many attendees and speakers had a true desire to help others learn. I could feel the sense of community.  I highly suggest that if you every get the opportunity to attend, go!  I am returning to work with a ton of new information that I can begin using immediately at my current job, it was a valuable experience.  I hope to see you there next year.

What I enjoyed most at Data Science Conference ODSC East 2018. Data analysis, data collection , data management, data tracking, data scientist, data science, big data, data design, data analytics, behavior data collection, behavior data, data recovery, data analyst. For more on data science, visit www.datamovesme.com
Read More
Career Career

How to Ace the In-Person Data Science Interview

I’ve written previously about my recent data science job hunt, but this article is solely devoted to the in-person interview. That full-day, try to razzle-dazzle em’, cross your fingers and hope you’re well prepared for what gets thrown at you. After attending a ton of these interviews, I’ve found that they tend to follow some pretty standard schedules.

But first, if your sending out job applications and aren't hearing back, you'll want to take a second look at your resume.  I've written a couple articles on how to create a strong resume.  One helpful article is

here.

You may meet with 3–7 different people, and throughout the span of meeting with these different people, you’ll probably cover:

  • Tell me about yourself

  • Behavioral interview questions

  • “White boarding” SQL

  • “White boarding” code (technical interview)

  • Talking about items on your resume

  • Simple analysis interview questions

  • Asking questions of your own

Tell me about yourselfI’ve mentioned this before when talking about phone screens. The way I approach this never changes. People just want to hear that you can speak to who you are and what you’re doing. Mine was some variation of:I am a Data Scientist with 8 years of experience using statistical methods and analysis to solve business problems across various industries. I’m skilled in SQL, model building in R, and I’m currently learning Python.

Behavioral Questions

Almost every company I spoke with asked interview questions that should be answered in the STAR format. The most prevalent STAR questions I’ve seen in Data Science interviews are:

  • Tell me about a time you explained technical results to a non-technical person

  • Tell me about a time you improved a process

  • Tell me about a time with a difficult stakeholder, and how was it resolved

The goal here is to concisely and clearly explain the Situation, Task, Action and Result. My response to the “technical results” questions would go something like this:Vistaprint is a company that sells marketing materials for small businesses online (always give context, the interviewer may not be familiar with the company). I had the opportunity to do a customer behavioral segmentation using k-means. This involved creating 54 variables, standardizing the data, plenty of analysis, etc. When it was time to share my results with stakeholders, I had really taken this information up a level and built out the story. Instead of talking about the methodology, I spoke to who the customer segments were and how their behaviors were different. I also stressed that this segmentation was actionable! We could identify these customers in our database, develop campaigns to target them, and I gave examples of specific campaigns we might try. This is an example of when I explained technical results to non-technical stakeholders. (always restate the question afterwards).For me, these questions required some preparation time. I gave some real thought to my best examples from my experience, and practiced saying the answer. This time paid-off. I was asked these same questions over and over throughout my interviewing.

White Boarding:

white boarding Interview

White Boarding SQL

This is when the interviewer has you stand at the whiteboard an answer some SQL questions. In most scenarios, they’ll tape a couple pieces of paper up on the whiteboard. I have a free video course on refreshing SQL for the data science interview

here.

White Boarding Code

As mentioned in my previous article. I was asked FizzBuzz two days in a row by two different companies. A possible way to write the solution (just took a screenshot of my computer) is below:

fizzbuzz Interview coding

The coding problem will most likely involve some loops, logic statements and may have you define a function. The hiring manager just wants to be sure that when you say you can code, you at least have some basic programming knowledge.

Items on Your Resume

I’ve been asked about all the methods I mention on my resume at one point or another (regression, classification, time-series analysis, MVT testing, etc). I don’t mention my thesis from my Master’s Degree on my resume, but casually referenced it when asked if I had previously had experience with Bayesian methods.

The interviewer followed up with a question on the prior distributions used in my thesis.

I had finished my thesis 9 years ago, couldn’t remember the priors and told him I’d need to follow up. 

I did follow up and send him the answer to his question, they did offer me a job, but it’s not a scenario you want to find yourself in. If you are going to reference something, be able to speak to it. Even if it means refreshing your memory by looking at wikipedia ahead of the interview. Things on your resume and projects you mention should be a home run.

Simple Analysis Questions

Some basic questions will be asked to make sure that you have an understanding of how numbers work. The question may require you to draw a graph or use some algebra to get at an answer, and it’ll show that you have some business context and can explain what is going on. Questions around changes in conversion, average sale price, why is revenue down in this scenario? What model would you choose in this scenario? Typically I’m asked two or three questions of this type.

I was asked a probability question at one interview. They asked what the expected value was of rolling a fair die. I was then asked if the die was weighted in a certain way, what would the expected value of that die be. I wasn’t allowed to use a calculator. 

Interview questions

Questions I asked:

Tell me about the behaviors of a person that you would consider a high-performing/high-potential employee.

Honestly, I used the question above to try and get at whether you needed to work 60 hours a week and work on the weekends to be someone who stood out. I pretty frequently work on the weekends because I enjoy what I do, I wouldn’t enjoy it if it was expected.

What software are you using?

Really, I like to get this question out of the way during the phone screen. I’m not personally interested in working for a SAS shop, so I’d want to know that upfront. My favorite response to this question is “you can use whatever open source tools you’d like as long as it’s appropriate for the problem.”

Is there anything else I can tell you about my skills and qualifications to let you know that I am a good fit for this job?

This is your opportunity to let them tell you if there is anything that you haven’t covered yet, or that they might be concerned about. You don’t want to leave an interview with them feeling like they didn’t get EVERYTHING they needed to make a decision on whether or not to hire you.

When can I expect to hear from you?

I also ask about the reporting structure, and I certainly ask about what type of projects I’d be working on soon after starting (if that is not already clear).

Summary

I wish you so much success in your data science interviews. Hopefully you meet a lot of great people, and have a positive experience. After each interview, remember to send your thank you notes! If you do not receive an offer, or do not accept an offer from a given company, still go on LinkedIn and send them connection requests. You never know when timing might be better in the future and your paths might cross.

To read about my job hunt from the first application until I accepted an offer,

click here

How to ace the data science in-person interview. Data analysis, data collection , data management, data tracking, data scientist, data science, big data, data design, data analytics, behavior data collection, behavior data, data recovery, data analyst. For more on data science, visit www.datamovesme.com.

Read More
Segmentation Segmentation

Designing and Learning With A/B Testing

I've spent the last 6 years of my life heavily involved in A/B testing, and other testing methodologies.  Whether it was the performance of an email campaign to drive health outcomes,  product changes, Website changes, the example list goes on. A few of these tests have been full factorial MVT tests (my fave). I wanted to share some testing best practices and examples in marketing, so that you can feel confident about how you're designing and thinking about A/B testing.As a Data Scientist, you may be expected to be the subject matter expert on how to test correctly.  Or it may be that you've just built a product recommendation engine (or some other model), and you want to see how much better you're performing compared to the previously used model or business logic, so you'll test the new model vs. whatever is currently in production.There is SO MUCH more to the world of testing than is contained here, but what I'm looking to cover here is:

  • Determining test and control populations

  • Scoping the test ahead of launch

  • test design that will allow us to read the results we’re hoping to measure

  • Test Analysis

  • Thoughts on automating test analysis

Choosing Test and Control PopulationsThis is where the magic starts.  The only way to determine a causal relationship is by having randomized populations (and a correct test design). So it's imperative that our populations are drawn correctly if we want to learn anything from our A/B test. In general, the population you want to target will be specific to what you're testing.  If this is a site test for an Ecommerce company, you hope that visitors are randomized to test and control upon visiting the website.  If you're running an email campaign or some other type of test, then you'll pull all of the relevant customers/people from a database or BigData environment who meet the criteria for being involved in your A/B test.  If this is a large list you'll probably want to take a random sample of customers over some time period. This is called a simple random sample. A simple random sample is a subset of your population, where every member had an equal probability of being chosen to be in the sample.

Here is a great example on how to pull a random sample from Hive: here

Also, just to be clear, writing a "select top 1000 * from table" in SQL is NOT A RANDOM SAMPLE. There are a couple different ways to get a random sample in SQL, but how to do it will depend on the "flavor" of SQL you're using.

Here is an example pulling a random sample in SQL server: here

Now that you have your sample, you'll randomly assign these people to test and control groups.There are times when we’ll need to be a little more sophisticated….Let’s say that the marketing team wants to learn about ability to drive engagement by industry (and that you have industry data). Some of the industries are probably going to contain fewer members than others. Meaning that if you just split a portion of your population into two groups, you might not have a high enough sample size in certain industries that you care about to determine statistical significance.Rather than putting in all the effort running the A/B test to the find out that you can’t learn about an industry you care about, use stratified sampling (This would involve doing a simple random sample within each group of interest).

Scoping Ahead of LaunchI've seen in practice when the marketing team doesn't see the results they want say "We're going to let this A/B test run for two more weeks to see what happens".  Especially for site tests, if you run anything long enough, tiny effect sizes can become statistically significant. You should have an idea of how much traffic you're getting to the particular webpage, and how long the A/B test should run before you launch. Otherwise, what is to stop us from just running the A/B test until we get the result that we want?Sit down with marketing and other stakeholders before the launch of the A/B test to understand the business implications, what they're hoping to learn, who they're testing, and how they're testing.  In my experience, everyone is set up for success when you're viewed as a thought partner in helping to construct the test design, and have agreed upon the scope of the analysis ahead of launch.

Test DesignFor each cell in an A/B test, you can only make ONE change. For instance, if we have:

  • Cell A: $15 price point

  • Cell B: $25 price point

  • Cell C: UI change and a $30 price point

You just lost valuable information. Adding a UI change AND a different price option makes it impossible to parse out what effect was due to the UI change or the $30 price point. We’ll only know how that cell performed in aggregate.  Iterative A/B testing is when you take the winner from one test and make it the control for a subsequent A/B test. This method is going to result in a loss of information. What if the combination of the loser from test 1 and the winner from test 2 is actually the winner? We’d never know!Sometimes iterating like this makes sense (maybe you don't have enough traffic for more test cells), but we’d want to talk about all potential concessions ahead of time.Another type of test design is MVT (Multivariate).  Here we'll look at a full-factorial MVT.  There are more types of multivariate tests, but full-factorial is the easiest to analyze.

  • MVT is better for more subtle optimizations (A/B testing should be used if you think the test will have a huge impact)

  • Rule of thumb is at least 100,000 unique visitors per month.

  • You'll need to know how to use ANOVA to analyze (I will provide a follow-up article with code and explanation for how to do this analysis and link it here later)

A/B learning control monitor

a/b test treatment monitors

One illustrative example of an MVT test is below.  The left (below) is the control experiences, and on the right are the 3 test treatments.  This results in 2^3 = 8 treatments, because we'll look at each possible combination of test and control.

On the left: The controls would be the current experience

On the right: Cell A could be new photography (ex: friendly waving stick figure), Cell B could reference a sale and, Cell C could show new content.

chart assignment in excel for a/b testing

We can learn about all the interactions! Understanding the interactions and finding the optimal treatment when changing multiple items is the big benefit of MVT testing.  The chart below shows you how each person would be assigned to one of the 8 treatments in this example.

In a future article I'll write up one of my previous MVT tests that I've analyzed, with R code.A/B Test AnalysisOne of the most important parts of test analysis is to have consistency across the business in how we analyze tests.  You don't want to say something had a causal effect, when if another person had analyzed the same test, they might have reached a different conclusion.  In addition to having consistent ways of determining conclusions, you'll also want to have a consistent way of communicating these results with the rest of the business.  For example, "Do we share results we find with a p-value greater than .05?" Maybe we do, maybe we don't, but make sure the whole team is being consistent in their communication with marketing and other teams.  Confidence intervals should always be given! You don’t want to say “Wow! This is worth $700k a year”, when really it’s worth somewhere between $100k and $1.3m. That's a big difference and could have an impact on decisions whether to roll out the change or not.Let's Automate our A/B Test Analysis!Why spend multiple hours analyzing each A/B test, when we can:

  • Automate removal of outliers

  • Build in not calculating statistical significance if the sample is not quite large enough yet

  • Determine statistical significance of metrics with confidence intervals and engaging graphs

  • See how A/B tests are performing soon after launch to make sure there aren’t any bugs messing with our results or large drops in revenue.

  • This also reduces opportunity for error in analysis

With a couple data entries and button pushes!This would take a while to build, and will not be a one size fits all for all of your tests.  Automating even a portion could greatly reduce the amount of time spent analyzing tests!I hope this article gave you some things to be on the lookout for when testing.  If you're still in school to become a Data Scientist, taking a general statistics class that covers which statistics to use and how to calculate confidence intervals is something that will benefit you throughout your career in Data Science.  Otherwise, there is certainly tons of information on the internet to give you an overview of how to calculate these statistics.  I personally prefer Coursera, because it's nice to sit back and watch videos on the content, knowing that the content is from well known universities.You can learn a ton through properly executed testing.  Happy learning!

Learning with A/B Testing in Data Science. Data analysis, data collection , data management, data tracking, data scientist, data science, big data, data design, data analytics, behavior data collection, behavior data, data recovery, data analyst. For more on data science, visit www.datamovesme.com

Read More
Career Career

The Successful Data Science Job Hunt

The point of this article is to show you what a successful Data Science job hunt looks like, from beginning to end. Strap-in, friends. I’m about to bring you from day 1 of being laid-off to the day that I accepted an offer. Seriously, it was an intense two months.I have an MS in Statistics and have been working in Advanced Analytics since 2010. If you’re new to the field, your experience may be different, but hopefully you’ll be able to leverage a good amount of this content.We’re going to cover how I leveraged LinkedIn, keeping track of all the applications, continuing to advance your skills while searching, what to do when you receive an offer, and how to negotiate.

Day 1 Being Laid-off

dyed my hair bright pink before job hunting

Vistaprint decided to decrease it’s employee headcount by $20 million dollars in employee salary, I was part of that cut. I was aware that the market was hot at the moment, so I was optimistic from day 1. I received severance, and this was an opportunity to give some real thought about what I would like my next move to be.I happened to get laid-off 4 days after I had just dyed my hair bright pink for the first time, that was a bummer.I actually went to one job interview with my pink hair, and they loved it. However, I did decide to bring my hair back to a natural color for the rest of my search.

Very First Thing I Did:

I am approached by recruiters pretty frequently on LinkedIn. I always reply.Although if you’re just getting into the field, you may not have past messages from recruiters in your LinkedIn mail, but I mention this so that you can start to do this throughout the rest of your career.Now that I was looking, my first action was to go through that list, message everyone and say:“Hi (recruiter person), I’m currently looking for a new opportunity. If there are any roles you’re looking to fill that would be a good fit, I’d be open to a chat.”

There were a number of people that replied back saying they had a role, but after speaking with them, it didn’t seem like the perfect fit for me at the moment.In addition to reaching out to the recruiters who had contacted me, I also did a google search (and a LinkedIn hunt) to find recruiters in the analytics space. I reached out to them as well to let them know I was looking. You never know who might know of something that isn’t on the job boards yet, but is coming on soon.

First Meeting With the Career Coach

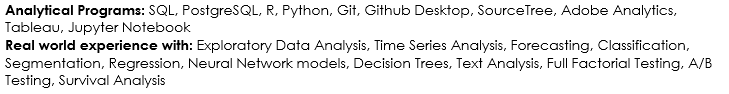
As part of the layoff, Vistaprint set me up with a career coach. The information she taught me was incredibly valuable, I’ll be using her tips throughout my career. I met with Joan Blake from Transition Solutions. On our first meeting, I brought my resume and we talked about what I was looking for in my next role.Because my resume and LinkedIn had success in the past, she did not change much of the content on my resume, but we did bring my skills and experience up to the top, and put my education at the bottom.

They also formatted it to fit on one page. It’s starting to get longer, but I’m a believer in the one page resume.I also made sure to include a cover letter with my application. This gave me the opportunity to explicitly call out that my qualifications are a great match with their job description. It’s much more clear than having to read through my resume for buzzwords.I kept a spreadsheet with all of the companies I applied to. In this spreadsheet I’d put information like the company name, date that I completed the application, if I had heard back, the last update, if I had sent a thank you, the name of the hiring manager, etc.This helped me keep track of all the different things I had in flight, and if there was anything I could be doing on my side to keep the process moving.

Each Application:

For each job I applied to, I would then start a little hunt on LinkedIn. I’d look to see if anyone in my network currently worked for the company. If so, they’d probably like to know that I’m applying, because a lot of companies offer referral bonuses. I’d message the person and say something like:Hey Michelle,I’m applying for the Data Scientist position at ______________. Any chance you’d be willing to refer me?

If there is no one in my network that works for the company, I then try and find the hiring manager for the position. Odds are it was going to be a title like “Director (or VP) of Data Science and Analytics”, or some variation, you’re trying to find someone who is a decision maker.This requires LinkedIn Premium, because I’m about to send an InMail. My message to a hiring manager/decision maker would look something like:

Hi Sean,I’m interested in the remote Data Science position, and I’m hoping I can get my resume in the right hands. I have an MS in Statistics, plus 7 years of real-world experience building models. I’m a wiz at SQL, modeling in R, and I have some exposure to Python.I’d appreciate the opportunity to speak with the appropriate person about the open position, and share how I’ve delivered insights and added value for company’s through the use of statistical methods.Thanks, Kristen

Most people actually responded, Joan (the career coach) was surprised when I told her about my cold-calling LinkedIn success.

I Started Applying to Jobs, and Started Having “Phone Screens”

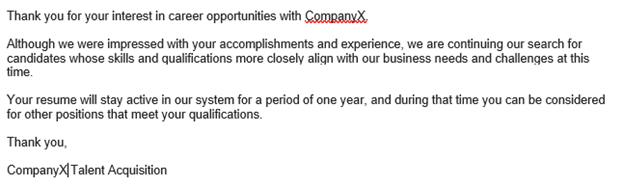
Phone screens are basically all the same. Some were a little more intense and longer than others, but they were all around a half hour, and they’re typically with someone in HR. Since it’s HR, you don’t want to go too deep in the technical stuff, you just want to be able to pass this stage, follow up with a note thanking them for their time, and try to firm up when you’ll be able to speak with the hiring manager :)Tell me about yourself:People just want to hear that you can speak to who you are and what you’re doing.

Mine was some variation of:

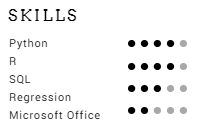
I am a Data Scientist with 7 years of experience using statistical methods and analysis to solve business problems across various industries. I’m skilled in SQL, model building in R, and I’m currently learning Python.

What are you looking to do?I’d make sure that what I’m looking to do ties directly to the job description. At the end of the day, it was some variation of:

“I’m looking to continuously learn new tools, technologies and techniques. I want to work on interesting problems that add business value”.

Then I’d talk about how interesting one of the projects on the job description sounded.What are you looking for in terms of salary?Avoid this question if you can, you’ll be asked, but try to steer in a different direction. You can always reply with “I’ve always been paid fairly in the past, I trust that I’ll be paid fairly working for [insert company name]. Do you have an idea of the salary range for the position”.They’ll know the range for the position, but they’ll probably tell you that they don’t. Most of the time I’d finally concede and give them my salary, this doesn’t mean that you won’t be able to negotiate when you receive an offer.

All The While, I’m Still Learning, And Can Speak to This in Interviews:

If I was going to tell everyone that I was very into learning technologies, I better be “walking the walk” so to speak. Although I am constantly learning, because it’s in my nature. Make sure that if you say you’re learning something new, you’re actually studying it.

The course I took was: Python for everybody

Disclaimer: This is an affiliate link, meaning that at no cost to you, I will earn a commission if you end up signing up for this course.

This course goes over your basic lists, arrays, tuples, defining a function.. but it also goes over how to access and parse web data. I had always wanted to know how to access Twitter data for future analysis, so this was super cool. The specialization (that’s the name they give for a series of courses on Coursera) also gives a brief overview in how to construct a database. This was a super bonus for me, because if I want to operationalize a model, I’m going to want to know how to write from Python to a database table. All-in-all, I found this course to be a great use of my time, and I finished it being able to speak to things intelligently, that I was not able to speak to prior to taking the course.

In Person Interviews:

I've written a whole article on in person interviews: here

At some point, you might receive a call saying they plan on putting an offer together for you, if you're still interested.Great! You’ve got an offer coming. At this point, you want to call all the other companies that you would consider an offer from and say “I’ve been informed that I am expecting an offer, is there anything you can do to accelerate your process?”I mentioned this to 2 companies. One of them did speed up their process and it resulted in an additional offer.  The other company said that they would not speed up their process, I thanked them for their time and said I'd hope to cross paths in the future.

Negotiating:

The phone rings, and you answer. This is it, you’re getting your first offer. It’s time to negotiate. Only a relatively small percentage of people ever negotiate their salary, the percentage is even smaller when we’re talking about women.Ladies! Negotiate! I’m here rooting for you, you got this.Joan from Transition Solutions had coached me on this. She said “Don’t try and solve the problem for them”.When they call, let them know how excited you are that they called, and that you’re interested in hearing their offer.

Once you’ve heard the salary, vacation time, and that they’re going to send over the benefits information, you can say something along the lines of:

"Thank you so much for the offer, I really appreciate it. You know, I was hoping that you could do more on the salary."

Then wait for a response, and again be positive. They’ll most likely say that they need to bring this information back to the hiring manager."

Great! I look forward to hearing back from you. I’ll take some time to look over the benefits package. Want to speak again on ____. I’m feeling confident that we can close this."

Then you’d be walking away from the conversation with a concrete time that you’ll speak to them next, and you let them know that you were happy to hear from them, all of this is positive!I successfully negotiated my offer, and started a week later. I couldn’t be happier with where I am now and the work I’m doing. It took a lot of applying and a lot of speaking with companies who weren’t “the one”, but it was worth it.To sum up my job search. I learned that a targeted cover letter and directly applying on a company website greatly increase the response rate on your applications.

I learned that you can effectively leverage LinkedIn to find the decision maker for a position and they’ll help keep the process moving if you’re a good fit. I also gained a ton of confidence in my ability to articulate my skills, and this came with practice. I wish you lots of success on your hunt, and I hope that there was a couple of tips in this article that you are able to use :)

The successful data science job hunt. Data analysis, data collection , data management, data tracking, data scientist, data science, big data, data design, data analytics, behavior data collection, behavior data, data recovery, data analyst. For more on data science, visit www.datamovesme.com.

Read More

What Getting a Job in Data Science Might Look Like

I’ve read a number of articles stating how hard it was to get into Analytics and Data Science. This hasn’t been my experience, so I wanted to share. We’ll look at interviewing, the tools I currently use, what parts of industry I wasn’t prepared for in school, and what my career trajectory has looked like. But not in that particular order.It probably makes sense to quickly recap my education before we dive in!

  • In 2004 — Completed a BS in Mathematics from UMASS Dartmouth

  • Had a 3.8 GPA in my major

  • Took FORTRAN while there (wasn’t good at it)

  • No internships

  • I LOVE math, and loved my time in school

Honestly, not much worth noting 2004–2007. I was “finding myself,” or something.In 2007 — Started MS in Statistics at WPI Part-Time while working for Caldwell Banker Real Estate Brokerage.

  • The “Housing bubble” burst (the kick-off for the Great Recession), and at the same time I was lucky to be offered a Teaching Assistantship at WPI.

  • Moved to Worcester and finished my MS Full-Time (Finished 2010)

  • Used SAS & R in classes

  • Still no internships (economy was bad, and I had yet to learn a ton about job searching, networking, and didn’t make use of the career center)

  • Thought I wanted to teach at a Community College, but two Professors asked if I’d be interested in interviewing at a local utility company (and the company happened to be 3 miles from my parents house).

I interviewed at that one company and took that job.At my first post-grad school industry job, NSTAR (now Eversource) I was a Forecast Analyst using Econometric Time-Series analysis to forecast gas and electric load (read — how much gas and electricity we need to service the customers).

Everyday I was building ARIMA models, using various statistical tests to test for structural breaks in the data, unit root tests for stationarity, and I wrote a proof to explain to the Department of Public Utilities why my choice of t-stats with a value > 1 (even though the p-value might be 0.2) were beneficial to have in the model for forecasting purposes.

I built cool Neural Nets to forecast hourly electric load. This methodology made sense because there is a non-linear relationship between electric load and the weather. The model results were fantastic, and were used to make decisions on how to meet capacity on days projected to need a high load.This is the first time that I learned that once you complete a project that people care about, you’ll most likely write a deck explaining the problem and outcomes.. and then you go “on tour”. Meaning, I created PowerPoint slides and presented my work to other teams. My first PowerPoint was not very good.

It has taken years of experience to get to a point where I now think that my decks are visually appealing, appropriately tailored for the audience I’m speaking to (have the right “level” of information), and engaging.

At NSTAR I also used a tiny bit of SAS. This was in the form of re-running code previously written by someone else. It sometimes also involved slightly modifying code that someone else had written, I definitely wouldn’t consider this job SAS intensive. More like “SAS button pushing”.

The models I was building everyday were built in “Point-and-Click” software.By far, NSTAR was my most “Statistic-y” job, but Time-Series is one small part in the world of Statistics. I wanted to expand my horizons, and learned that there was A TON of opportunity in Analytics…Quick Overview of The Rest Of My Positions: Analytics Consultant, Silverlink Communications

  • Delivered market research, segmentations, research posters, and communication campaigns designed to support managed care organizations (MCOs), pharmacy benefit managers (PBMs), and disease management (DM) clients.

Analytics Manager, Vistaprint

  • Vistaprint sells business cards and other marketing products online. Their main customer base is small businesses.

  • Managed a team of analysts to optimize the Vistaprint website.

  • Held a bunch of other roles and work on a ton of different projects across Analytics

Senior Data Scientist, Constant Contact

  • Contant Contact offers email marketing solutions. Also Ecommerce, also targets small businesses.

I’ve been at Constant Contact now for 2 months. My first goals are:

  • Checking the validity of a model that is already in place.

  • Improving upon how they currently do testing. And then automating!

  • Trying to identify seasonal customers in their customer base.

  • Learning lots of new things!

A Note on Titles: Titles are tricky. A title may sound snazzy and not pay as much, and sometimes a lower title could pay more than you expect!As leveraging data for business purposes is becoming increasingly popular, there is even more confusion around what roles and responsibilities and skills would typically fall under a certain title. Explore all of your options!You can check out average salaries for titles on a number of different sites.

The Tools I Use (Starting From Most Basic):Everywhere I have been has used Excel. The ability to do:

  • Pivot tables

  • V-lookups

  • Write a simple macro using the “record” button to automate some data manipulations

  • These types of things can make you look like a WIZARD to some other areas of the business. (Not saying it’s right, just saying that’s how it is)

  • And I’ve used these things THROUGHOUT my career.

As data is getting bigger, companies are starting to move towards Tableau. I’m still new to it myself, but it has saved me from watching an Excel document take forever to save. I consider the days of waiting on large Excel files to mostly be just a thing of my past.

  • Data quickly becomes too large for Excel, I’ve found that anything higher than like 400k rows (with multiple columns) becomes a real chore to try and manipulate.

  • Pretty visualizations, can be interactive, quick, point-and-click.

Data Science Tableau chart image

  • Tableau can also take data in directly from SQL (a .csv, and a bunch of other formats as well).

Data Science example of a simple query

Data Science use the command line to access Hive

Data Science example of my Python code in JupyterLab

The real workhorse of a job in Data Science in SQL. It's becoming more common to pull directly to R or Python from SQL and do your data manipulation there, but this still requires connecting to the database.In school, most of the data was given to me in a nice form, all I had to bring to the table was analysis and modeling. In industry, you have millions of rows in 100’s or 1,000’s of different tables.

This data needs to be gathered from relevant tables using relevant criteria. Most of the time you’ll be manipulating the data in SQL to get it into that nice/useable form that you’re so familiar with. And this is time intensive, you’ll start to realize that a significant portion of your job is deciding what data you need, finding the data, transforming the data to be reasonable for modelling, before you ever write a line of code in R or Python.My last 3 jobs in industry have involved SQL, and I’ve only had 4 jobs.You can pull data directly from SQL into Excel or R or Python or Tableau, the list continues.

There are many different “flavors” of SQL. If you know one, you can learn any other one. In the past, I had been intimidated by job postings that would list APS or some other variant. There may be slight differences in syntax, but they’re really just asking you to know SQL. Don’t be intimidated!Below is an example of a simple query. I’m selecting some id’s, month, year, and the count of a variable “sends” based on criteria given in the “where” statement. The query also shows a couple table joins, denoted by “join”, and then I give the criteria that the join is on.Once you understand SQL, making the jump to BigData is not as daunting. Using Hive (also something that looked intimidating on a job description), is much like SQL (plus some nested data you might need to work with), you can query data from Hadoop.I use the command line to access Hive, but nice UIs are out there.

If you look closely, you’ll see my query here is just “select account_id from contacts limit 1;” all that says is “give me one account_id from the contacts table”, and it looks just like SQL.

When I was getting my Masters in Statistics, everyone was using R. Even some statisticians now are making the move to Python. Previously, all of my modeling has been in R, but I’m testing the Python waters myself!

I taught myself Python in Coursera, and I’m currently using it in my new job. That’s the beauty of the internet. Want to learn a new tool? Just go learn it, the information is at your fingertips.Below is an example of my Python code in JupyterLab. It brand-spanking new, and really my screenshot does not do it justice. You can read more about JupyterLab here: JupyterLab

A quick note. I put my Coursera classes I’ve taken under “accomplishments” in LinkedIn. It’s not a bad idea.

Things I Didn’t Know About Industry:

You might have some Opportunity for travel — Fun-ness of destination can vary

  • I’ve been to Vegas, Orlando, Barcelona, Windsor Ontario, NJ and MD for Work.

There is typically budget for personal development

  • A book you want to read that is relevant? You can probably expense it.

  • A course on Coursera that is relevant? You can probably expense it.

  • They’ll send you to conferences sometimes

    • Was at the Jupyter Pop-up March 21st and I’m attending the Open Data Science Conference in May.

      1. Don’t be shy about asking your boss if there is budget available.

        • To most it looks like you care about and are invested in your career!

Layoffs are a thing. I recently just learned about this first hand. And my experience was great.Vistaprint decided to downsize by $20m in employee salaries (182 people).

  • I got a pretty sweet severance package.

  • Tip! You can collect unemployment and severance at the same time!

This was the first opportunity I had in years to really think about the culture, direction, and really think about my next move.Vistaprint paid for a Career Coach that helped me with:

  • resume (they updated both my content and formatting).

  • Cover letter tips (description below)

  • Networking

  • Interviewing

  • Negotiating!

I literally took the requirements from the job and pasted them on the left. Then took my qualifications from my resume and posted them on the right. Took less than 15 minutes for each cover letter.

Interviewing

To read my more in-depth article about the in person interview in data science, click  here

To read my more in-depth article about the job hunt in data science from the first application to accepting a job offer, click 

here

The biggest takeaways I learned from the coach and my own experience interviewing for a Data Scientist position were…

Practice answering questions in the STAR format.

https://www.vawizard.org/wiz-pdf/STAR_Method_Interviews.pdf

In one phone screen (with Kronos), I was asked all of the questions I had prepared for:

  • Tell me about a time you explained a technical result to a non-technical audience?

  • Tell me about a time you improved a process?

  • Tell me a time about working with a difficult stakeholder, and how it was resolved?

TWO DAYS in a row, with different companies (one of them was Spotify), I was asked to answer FizzBuzz.

Prepare talking about one of your projects in a way that the person interviewing you (who may have little context) is able to understand. High Level, focus on outcomes. Seriously, before you start talking about the project, describe what the objective was, it’s really easy to dive into something and not realize the other person has no idea what you’re talking about.I could really keep talking forever about the topics listed above, but wanted to give a brief overview hitting a bunch of different pieces of my experience. Maybe I’ll need to elaborate more later.Thank you for reading my experience. I hope you have great success navigating your way into the field of Data Science. When you get there, I hope you find it fulfilling. I do.

What the successful data science job hunt might look like. Data analysis, data collection , data management, data tracking, data scientist, data science, big data, data design, data analytics, behavior data collection, behavior data, data recovery, data analyst. For more on data science, visit www.datamovesme.com.

Read More
Segmentation Segmentation

Target Customers By Learning with Customer Segmentation

It’s easy to get people to buy into the idea of “Don’t test to win, test to learn.” However, when it comes to segmentation, it’s sometimes more difficult to get people over to the camp of “Don’t segment to align with your previously held ideas, segment to learn.” This may be because this saying is certainly not as short, sweet, and catchy; but I’m a strong believer in segment to learn.

I’ve been approached before with: “We did a segmentation of the market; can you tie this back to our customer base?”. This means that they did a segmentation based on survey data of the population, these people could be using your product, but they’re not necessarily using your product. This survey probably asked about the functionality they need, what they’re trying to do, and who they are.

Although sometimes we might do things with data that mystify and dazzle, we are not wizards. I cannot take your segmentation of the market and find those same segments in our customer base. Our customers are not necessarily representative of the market, and I don’t have your market survey data for all customers. But what I have is even more precious, actual behaviors that your customer has taken.

These actions include things like:

· I can see how often someone has visited our website

· Are they buying certain products and not others?

· What are they doing on our site? Reading informative articles? Visiting a lot but not converting?

· How often they’re purchasing.. Are these less expensive or more expensive products?

· If they’re calling customer service.. Did they just need help finding a product? Or were they unhappy and looking for a refund?

· How long they’ve been with us

· How were they acquired (channel)?

· Are they being upsold or cross-sold products?

This type of information is hopefully in your database, somewhere. If not, you may be able to find a way to get at it.

We could also append data from a data vendor if we have the budget. There are companies like Epsilon, Full Contact or Axiom (to name a few). If you have the budget to do this, and send them customers name, address, and some other information, they can add columns for things like:

· Income

· Race

· Education

· Employment

· Spend behavior

· Lifestyle and interests

· And more!

This would give you lots of great data to play with. The other option might be appending Census data at the zip code level. All this data could be analyzed and potentially be meaningful in creating a segmentation.

There is another instance of this problem manifesting itself more directly. When we do find ourselves in the position to do a segmentation of our customer base, I sometimes hear: “We’d like to do a segmentation, I’m thinking segments like….” Here people are explicitly using a segmentation to reinforce their previously held beliefs.

Think of how you’d be short changing yourself. Think of all the variables that you could come up with! Be innovative! Create variables that the business has never looked at before.

Try to identify a way to determine:

· Who are your seasonal customers?

· Who in your base responds to your marketing campaigns? And how?

· Time between different forms of engagement with purchasing your product or visiting the website.

You can create a segmentation around acquisition or retention, where you know what you’re trying to optimize. And these types of segmentation certainly fall into “segment to learn”, my favorite is when we use an unsupervised algorithm.

There was a great article on by john Sukup on DataScience.com, that explains some drawback of k-means and offers some different solutions. Check it out! I also used his code to make the clusters visual at the top of my article.

And once you have that output that makes sense, start learning! Learning is a manual process that typically involves doing a lot of crosstabs (at least in my experience it has been), but you can take that back to the business with a big smile and recommendations on how to target the customers in the segments. Show them what you’ve learned and let them know it’s ACTIONABLE. These are the segments that you can easily add to your database and use to build campaigns.

Summary:

Segmentation is an enjoyable experience, where you learn a ton about who your customers are. This will allow you to help determine what type of content might be most appropriate, and nurture these customers appropriately. If you're interested, I have another article on how to get buy-in from the business to get support for you big projects.  That article is here.  I’m amped up just thinking about data and cluster analysis. Hope you are too.

Target customers by learning with customer segmentation. Data analysis, data collection , data management, data tracking, data scientist, data science, big data, data design, data analytics, behavior data collection, behavior data, data recovery, data analyst. For more on data science, visit www.datamovesme.com.

[/et_pb_text][/et_pb_column][/et_pb_row][/et_pb_section]

Read More