
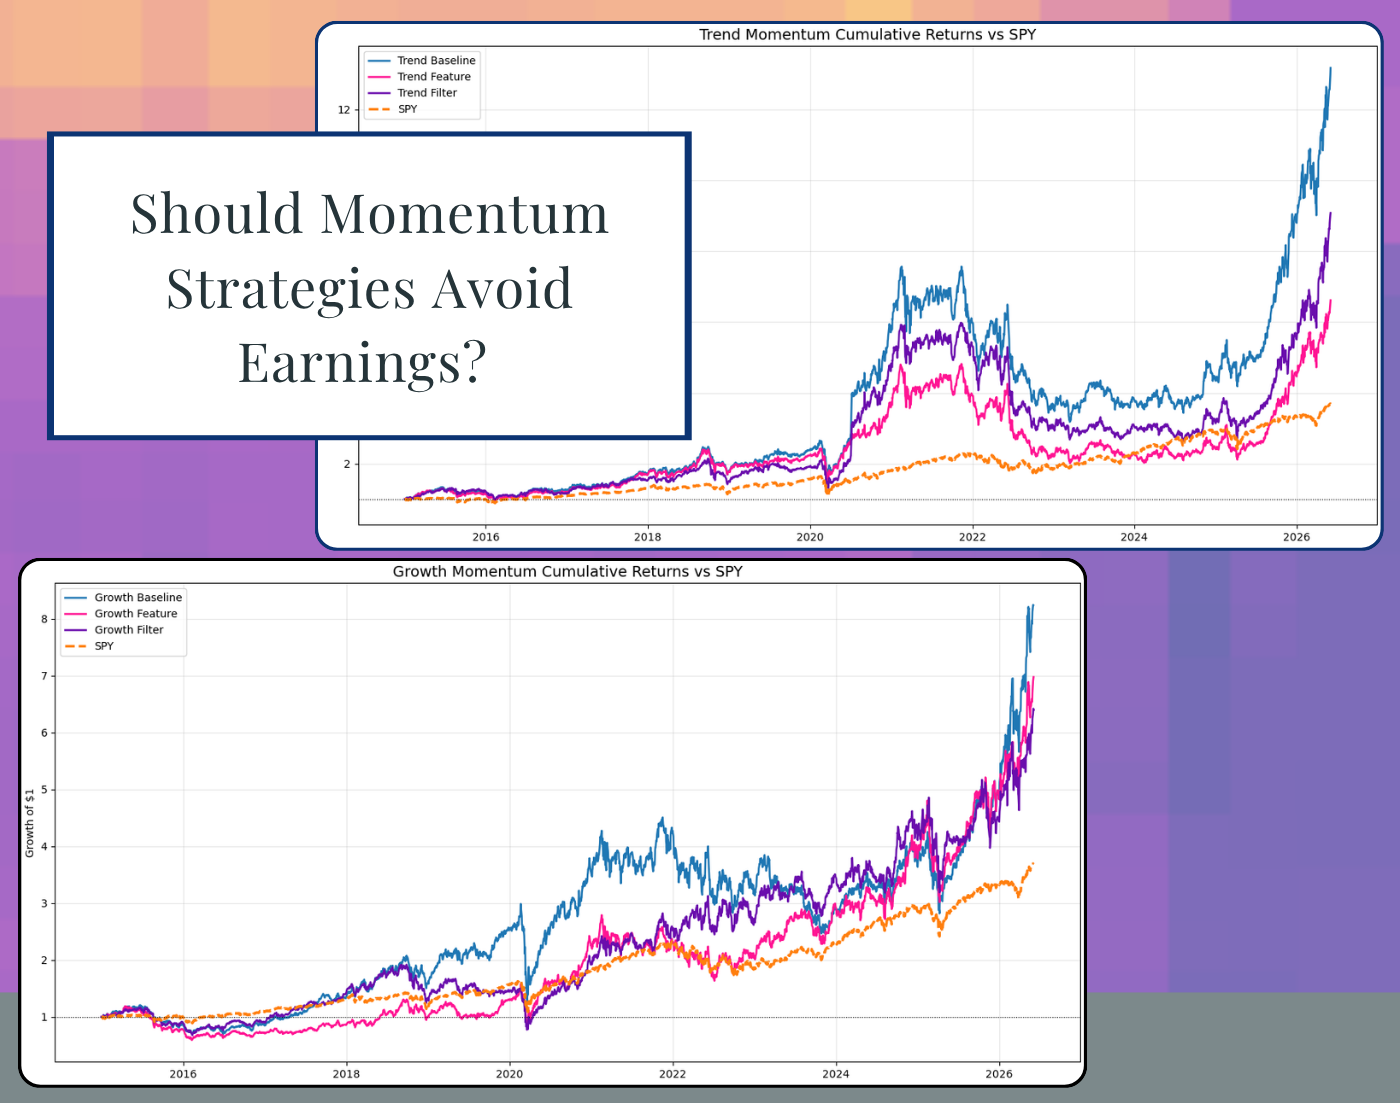
How Do Earnings Events Impact a Momentum Strategy? A Backtest Across Two XGBoost Models
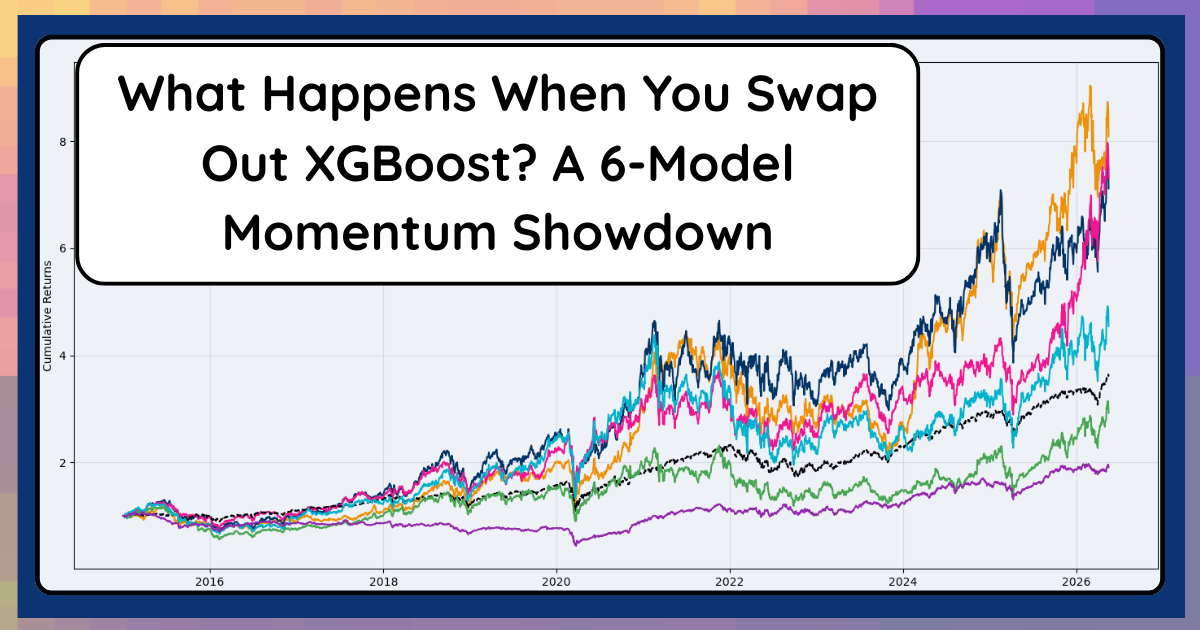
What Happens When You Swap Out XGBoost? A 6‑Model Momentum Showdown
Comparing XGBoost, LightGBM, CatBoost, Random Forest, LASSO, and a Neural Net in the same momentum trading system using identical features and backtests. All three GBMs beat the S&P on default settings.

My Systematic Trading Update: The Good, the Honest, and 75% YTD
I'm up 75% YTD on a $5,000 account — and this is the honest version of how I got here. The wins, the 29% drawdown, the execution mistakes, and what I'm still doing manually that I shouldn't be.

Why Data Scientists Can Make Great Algorithmic Traders - Interview with Jason Strimpel

The Moment My Trading Went From Demo to Professional (Quant Science Level 2 Review)

Why You Should Be Using MLflow to Track Backtests for Algo Trading (Even Without Machine Learning)
A Data Scientist’s Journey into Algorithmic Trading with Quant Science
Creating Your Own Chatbot: A Beginner-Friendly Tutorial with OpenAI, LangChain, Gradio, and Wikipedia
Object Detection Using YOLOv5 Tutorial – Part 3
Object Detection Using YOLOv5 Tutorial
Concatenating and Splitting Strings in R
Using Rename and Replace in Python To Clean Image Data
An Analysis of The Loss Functions in Keras
How To Create A Computer Vision Dataset From Video in R
Analytics Interview Questions You Want To Ask Your Future Employer
Business Science’s Time Series Course is Incredible
I’m a time series fan. Big fan. My first job out of grad school was for a utility company building econometric time series analysis and forecasting models. Lots of ARIMAs and neural nets. However, that was now over 10 years ago (don’t know how the hell that happened).